Campaign summary report
What is it?#
The campaign summary report presents all aspects of a campaign’s performance. The report displays :-
- Campaign overview with summary information
- Performance snapshot
- Channel-wise detailed analysis
- Benchmarking information
Data becomes available on this report about 7 hours after campaign launch and is updated in real time.
Authorization and making changes#
This report can be accessed by all user types on the platform.
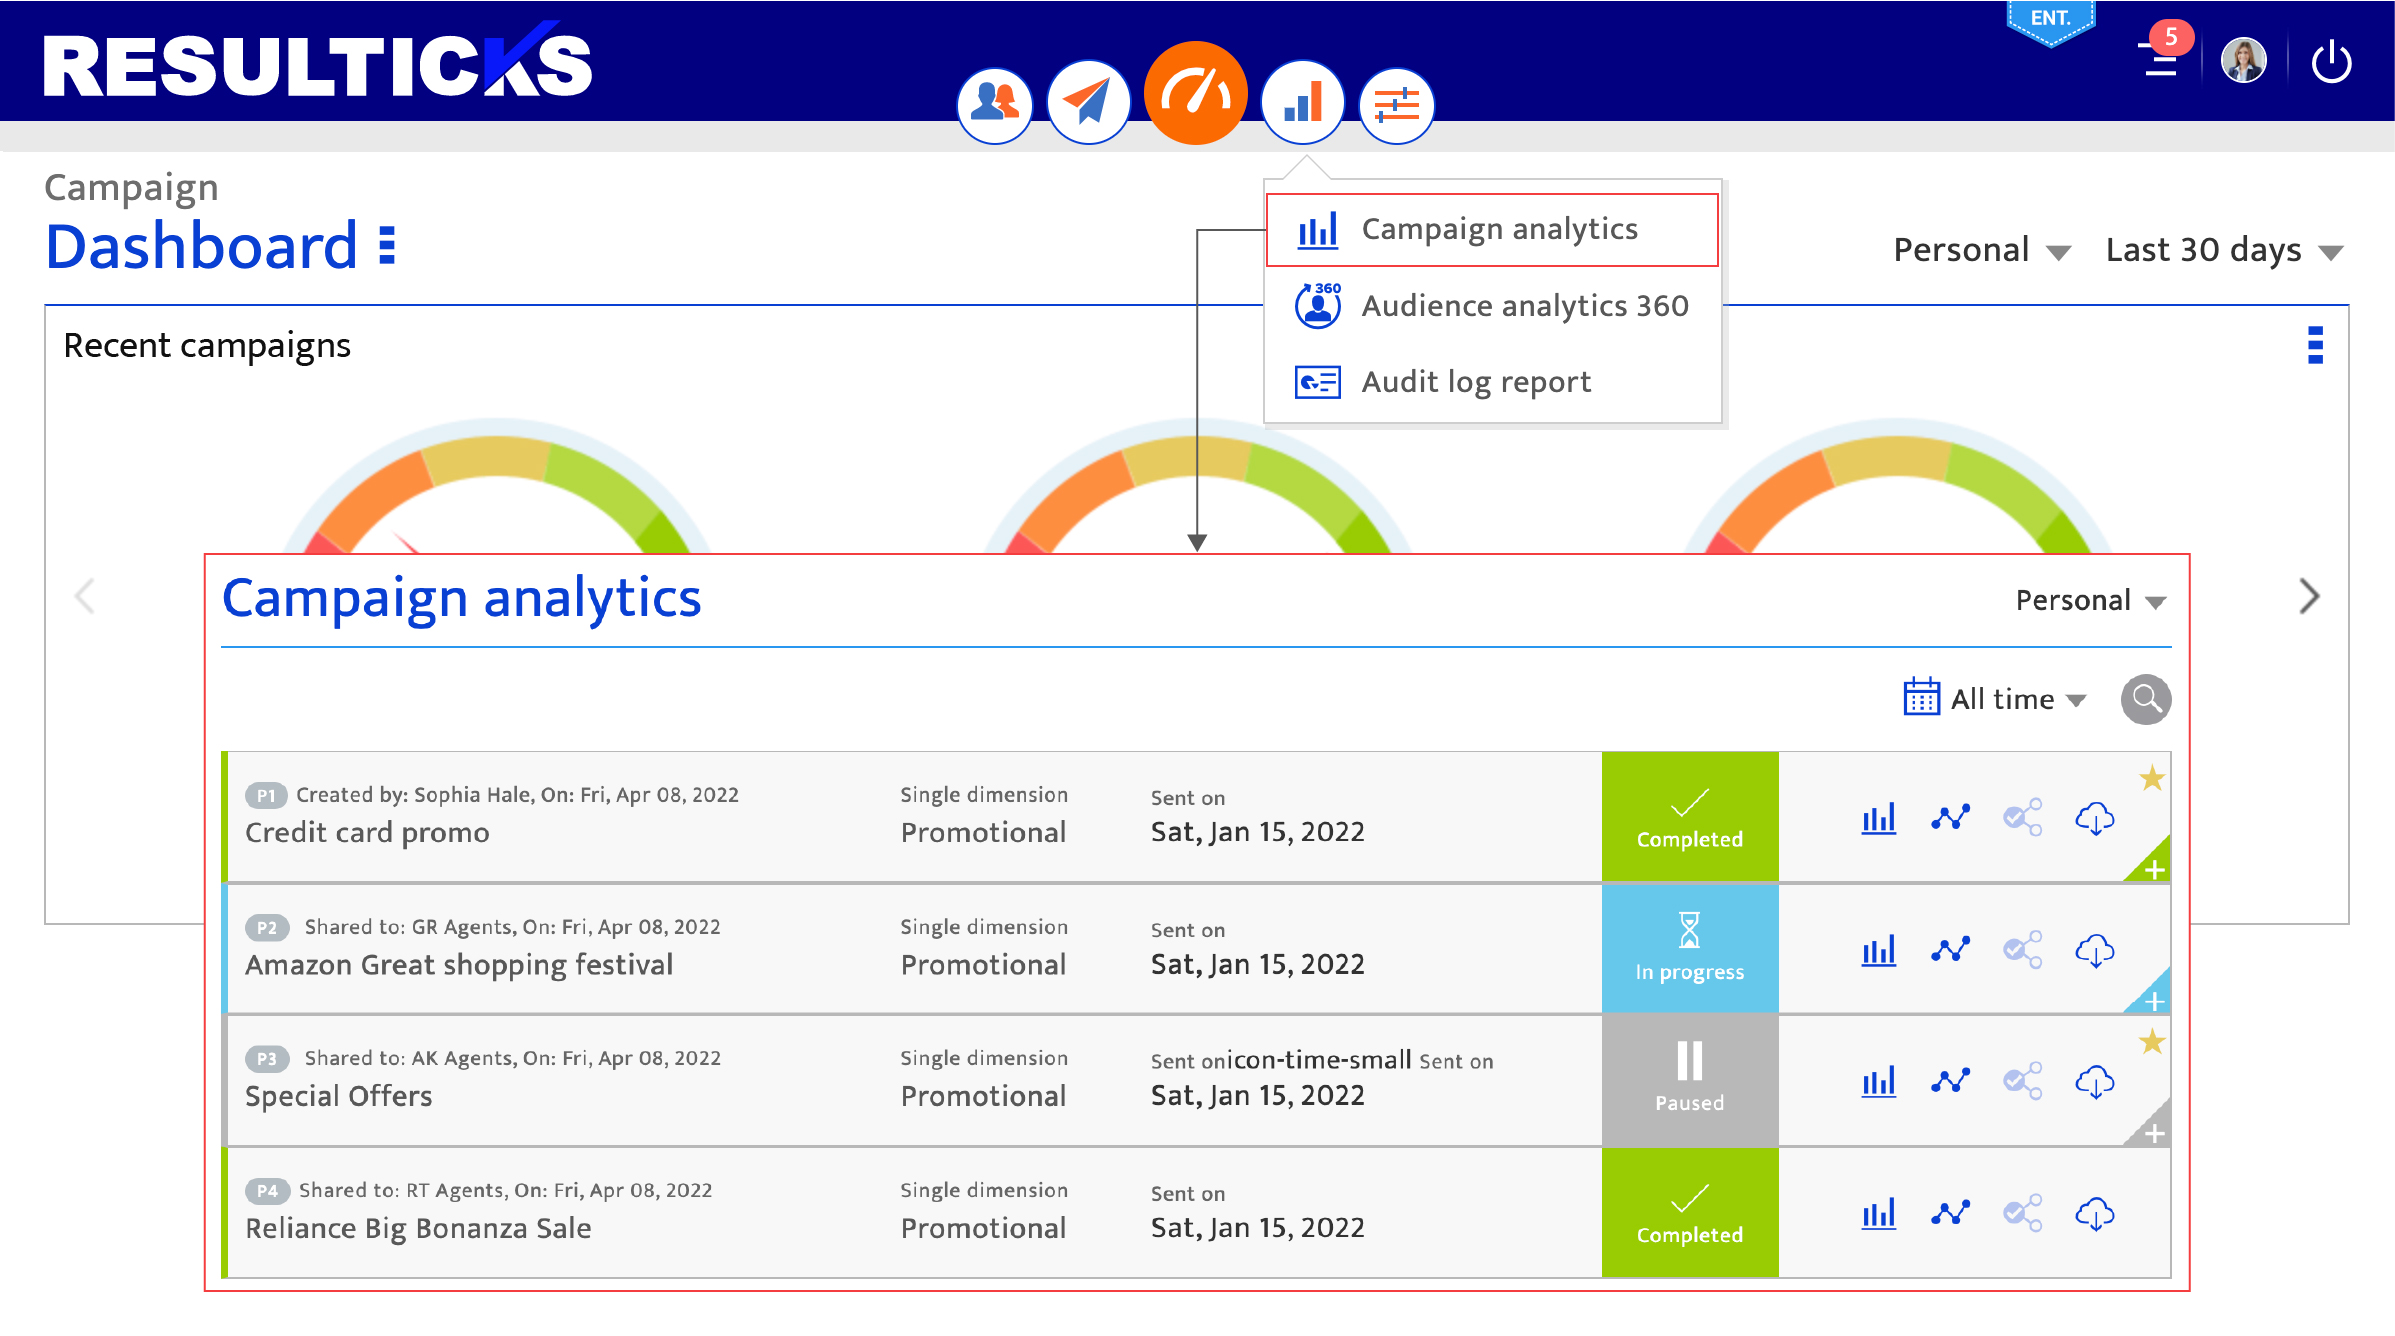
Accessing the report#
- Select the Analytics module
- Select Campaign analytics from the drop-down list.
- Select a Campaign from the campaign list
- Click on the Analytics icon
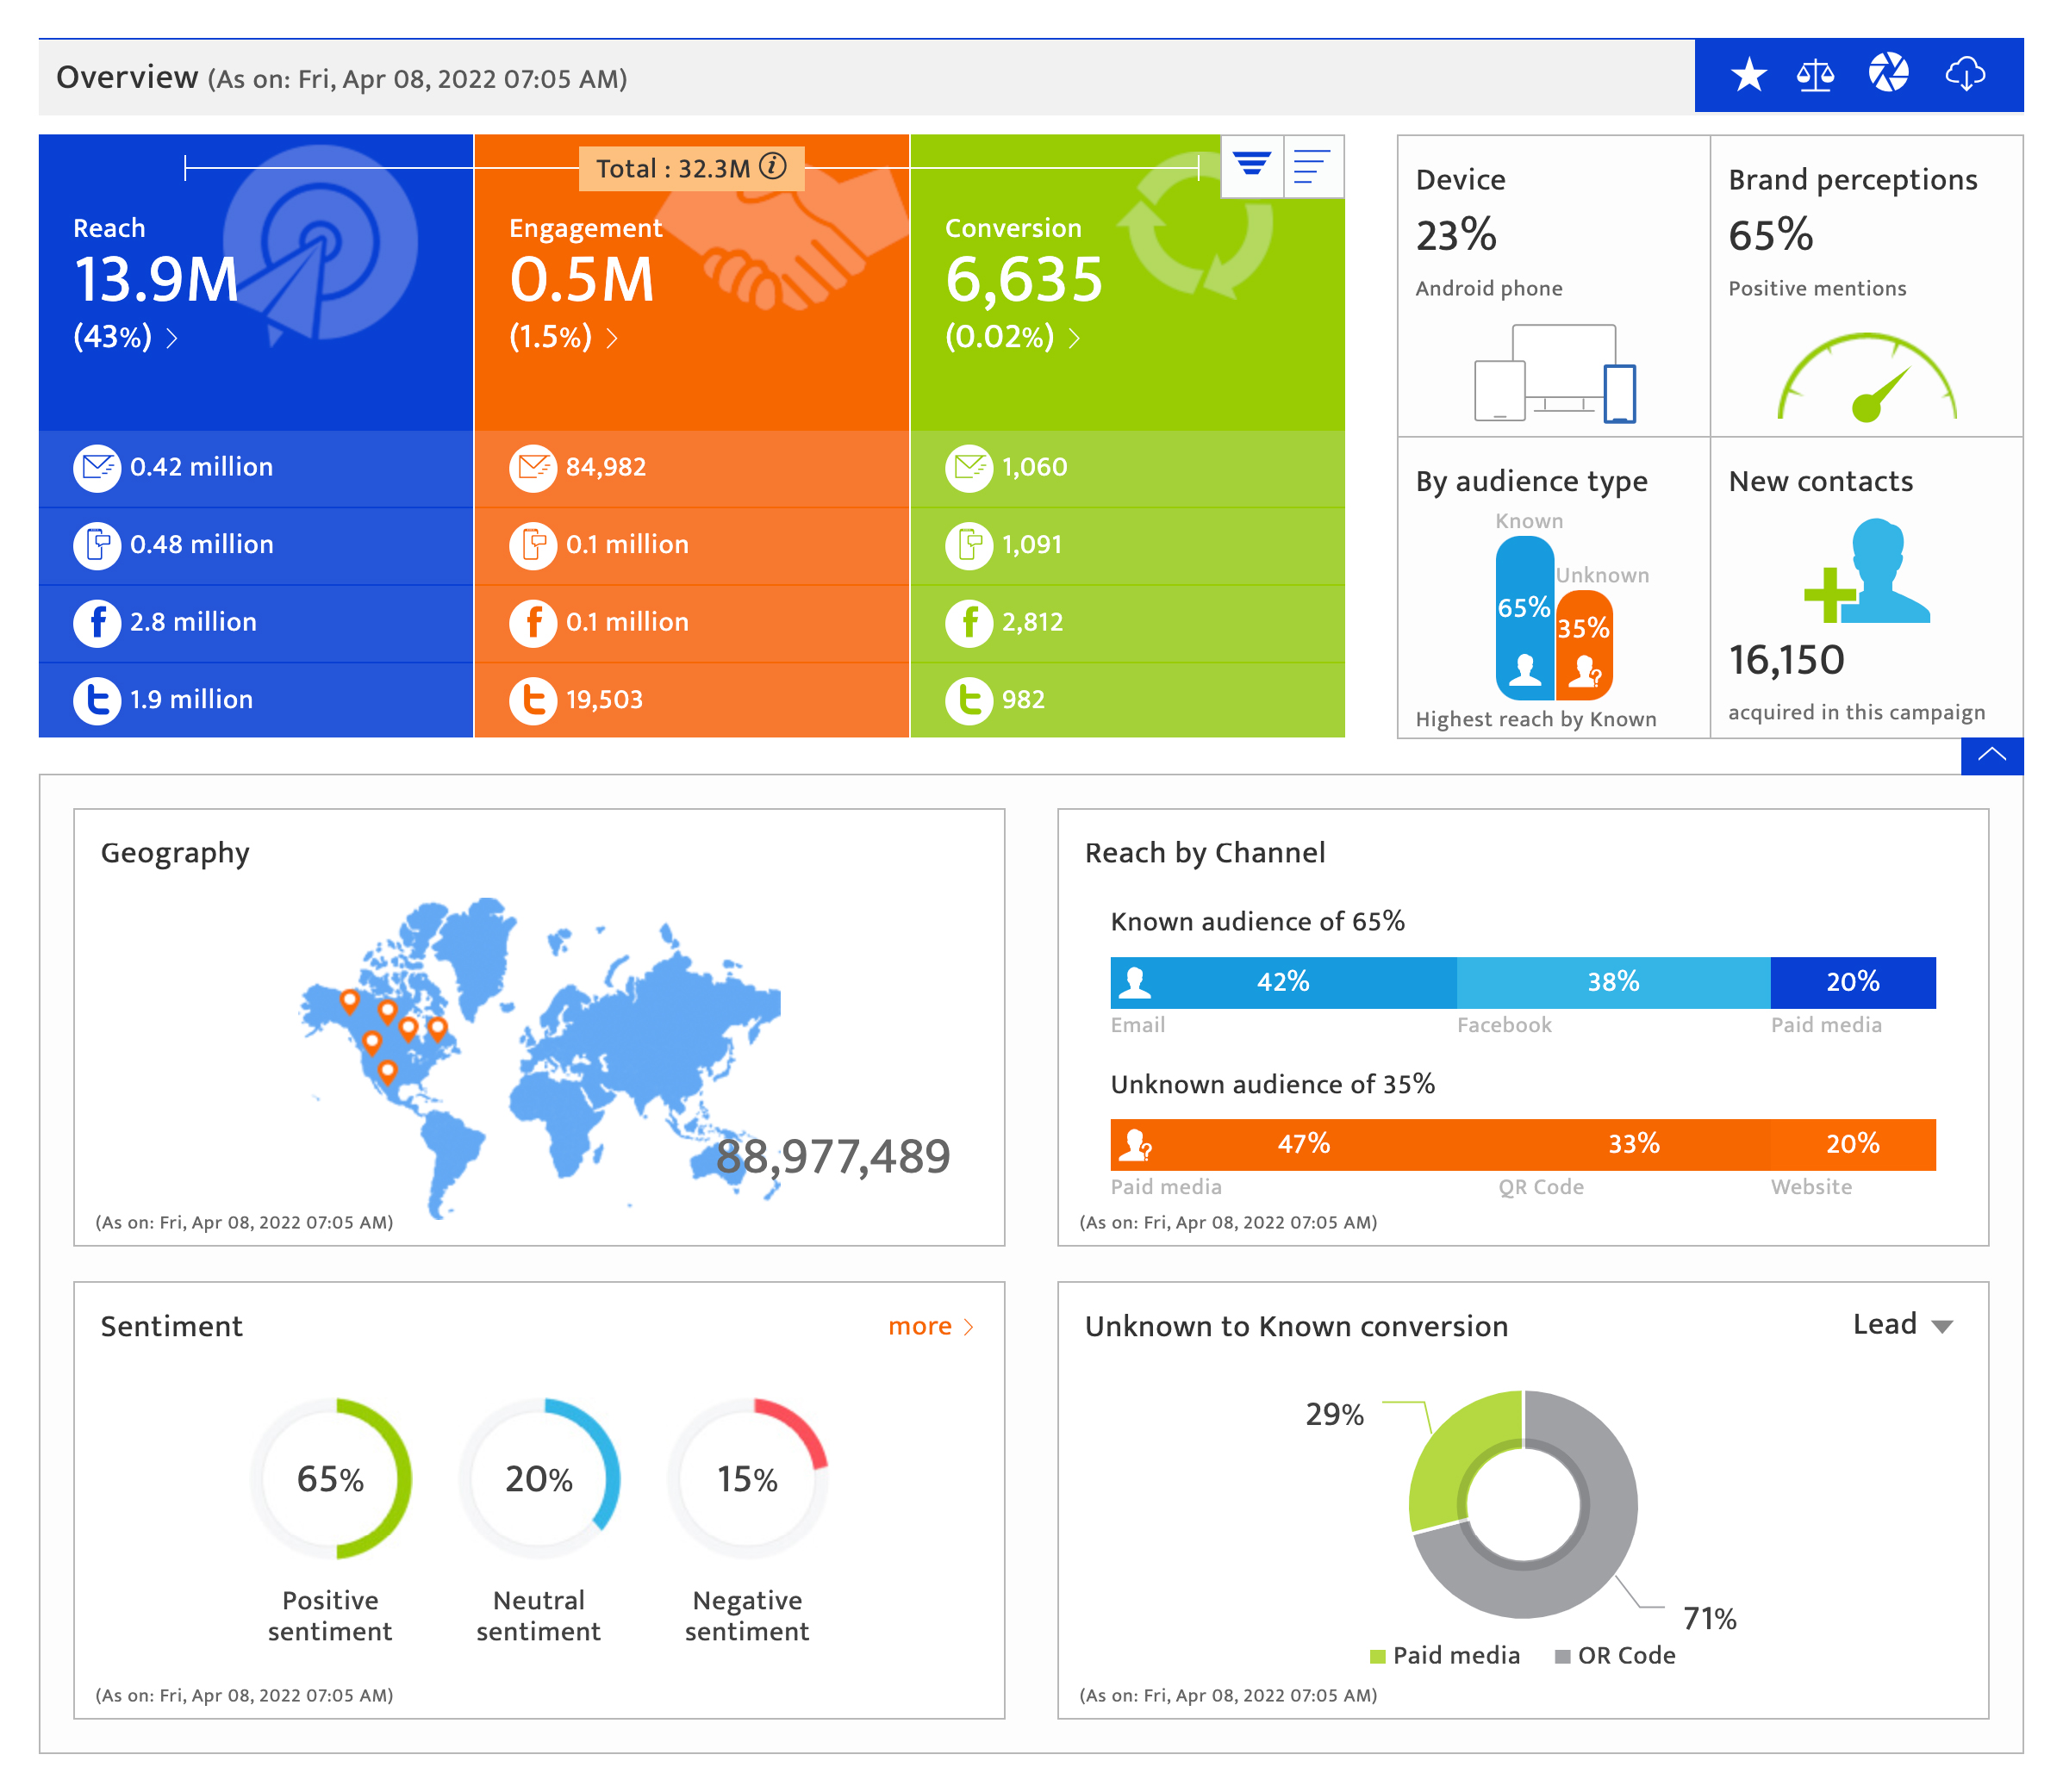
Using the campaign summary section#
This section displays the overall reach, engagement and conversion numbers of the campaign, along with drill-down information across other parameters.
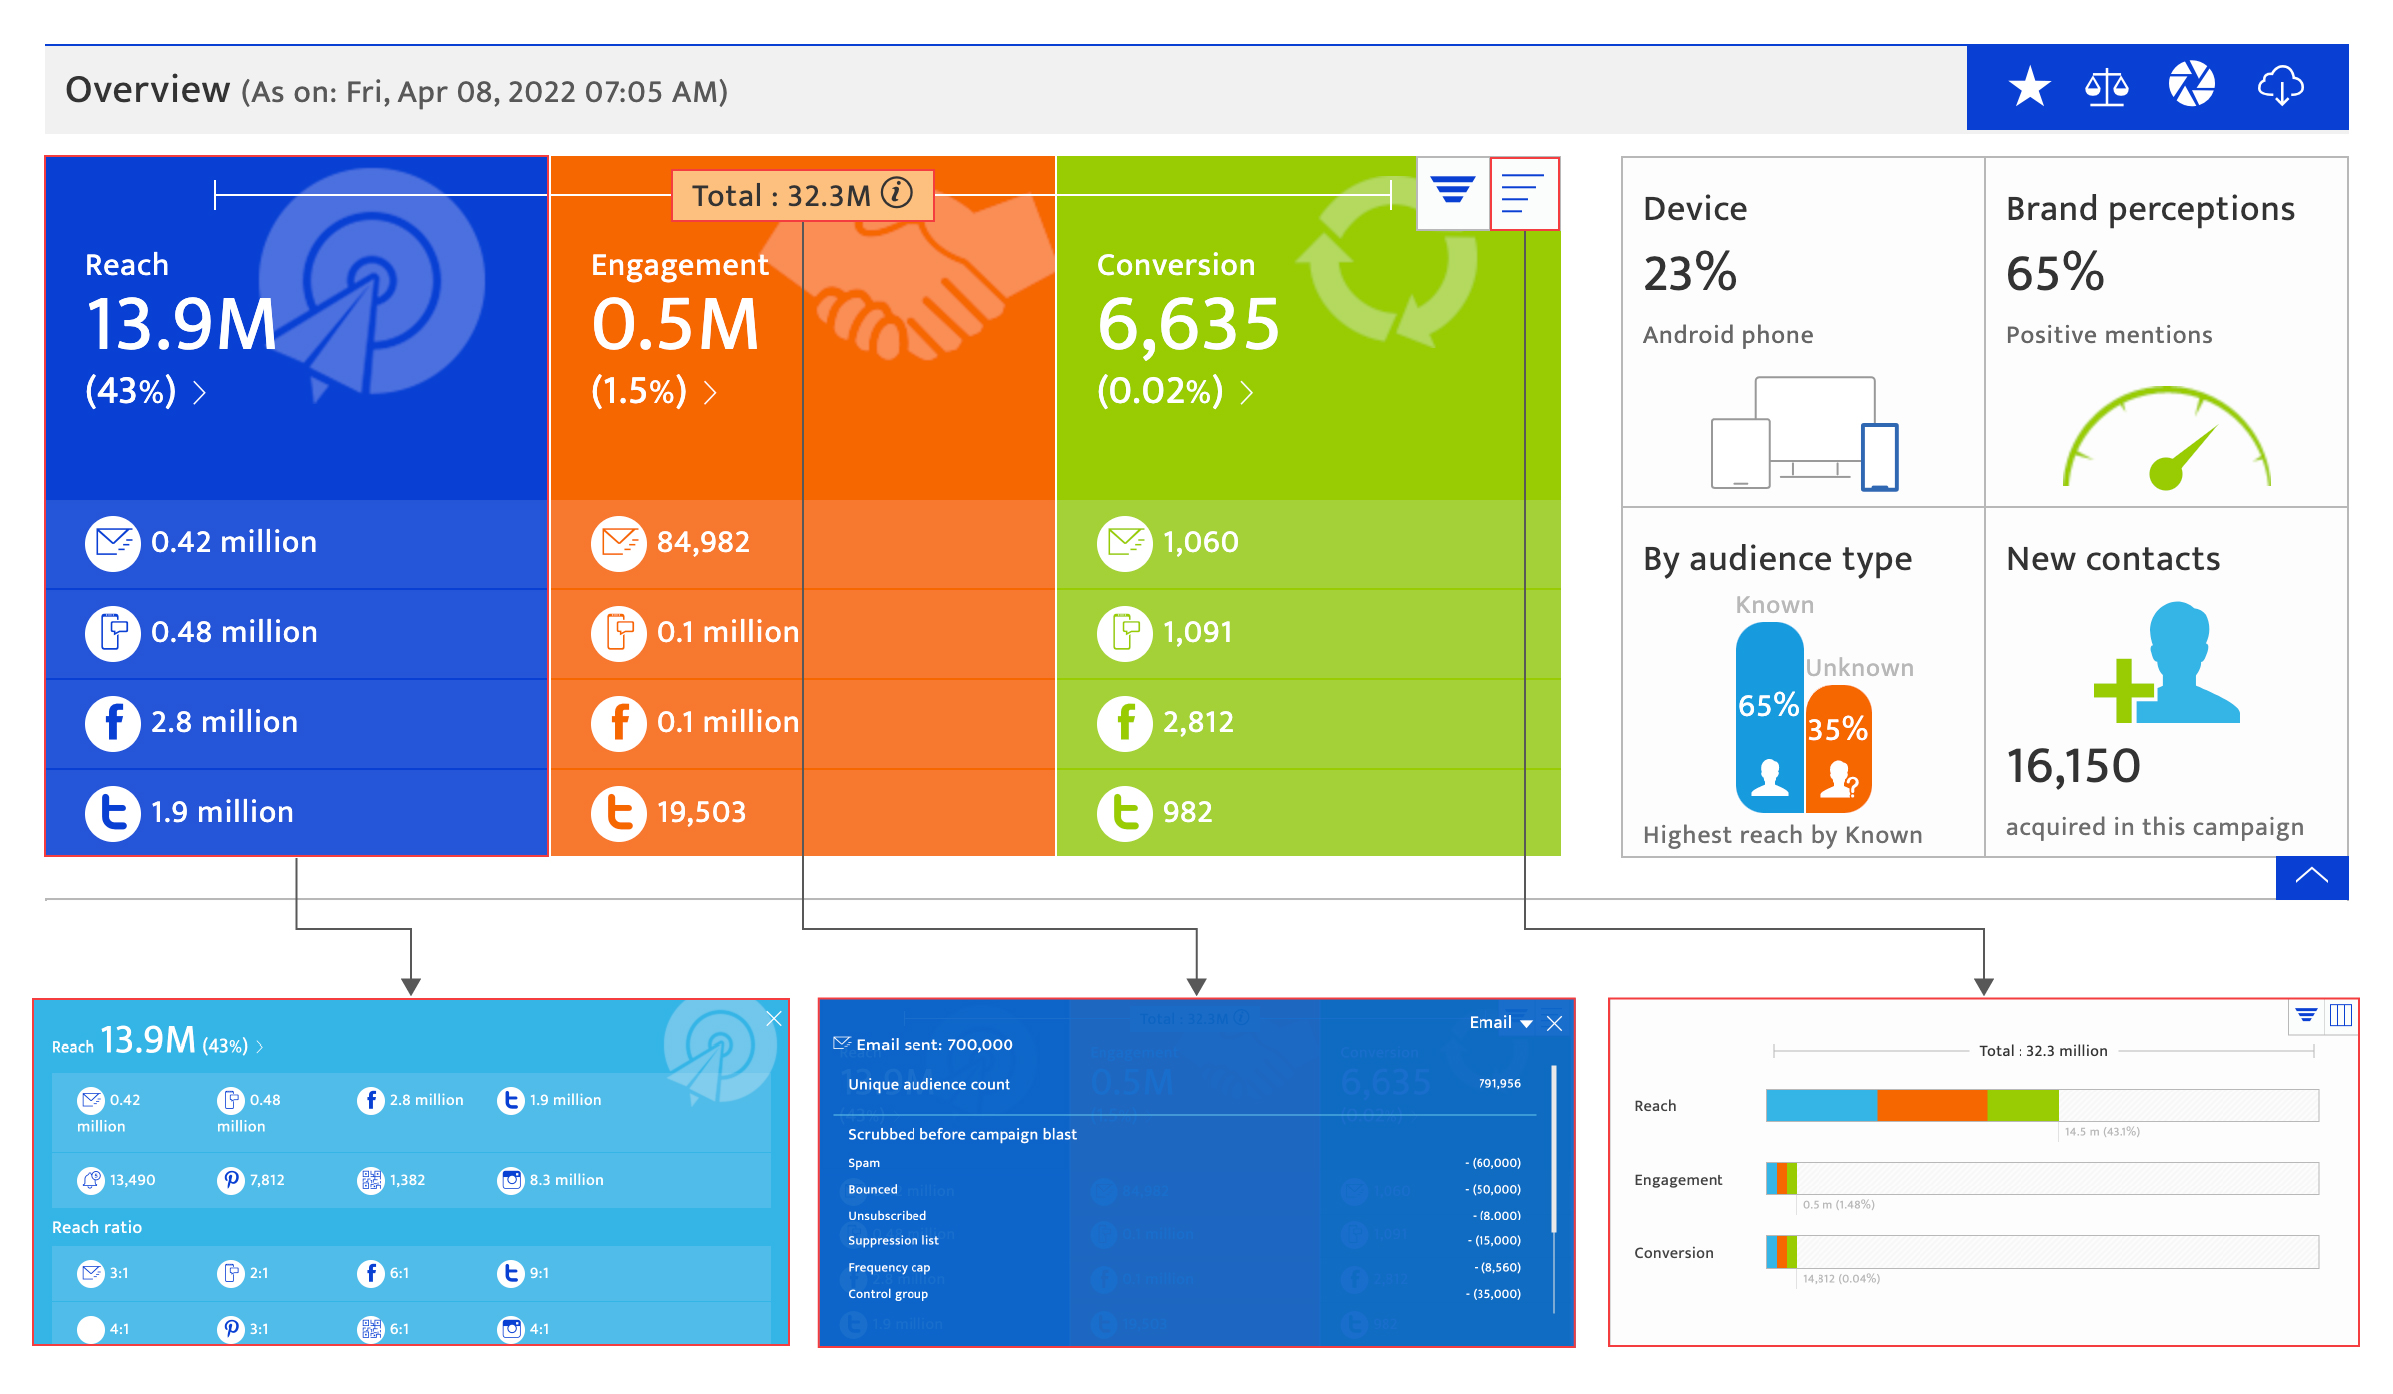
Campaign reach, engagement, conversion, and total audience
Reach, engagement and conversion are split into columns, each summarizing the results specific to that metric. sizes, rate, and ratios of the entire campaign. At the bottom of each column are the four top-performing channels and their reach/engagement/conversion sizes.
- View the total audience size of the campaign and click the information icon to see the audience sizes for the campaign channels and more.
- View reach, engagement, and conversion metrics in three columns. At the bottom of each column are the four top-performing channels. Click each column to see their respective numbers and ratios for all channels.
- Change to a bar-graph view by clicking the graph icon at the top right corner of this section.
Geographic insights, demographics, audience sentiment, lead generation
On loading the report, this section displays :-
- The geography with the largest audience size for this campaign
- The prevailing brand sentiment generated through this campaign
- The gender breakdown amongst the campaign audience
- The number of new contacts acquired through the campaign.
To access more insights, click the arrow button on the bottom right, which will display :-
- Geographic distribution of the campaign audiences
- Gender distribution amongst the campaign audience based on age group
- Sentiment distribution. Click more to see the Detailed ORM Analytics Report
- Lead generation breakdown by channel source.

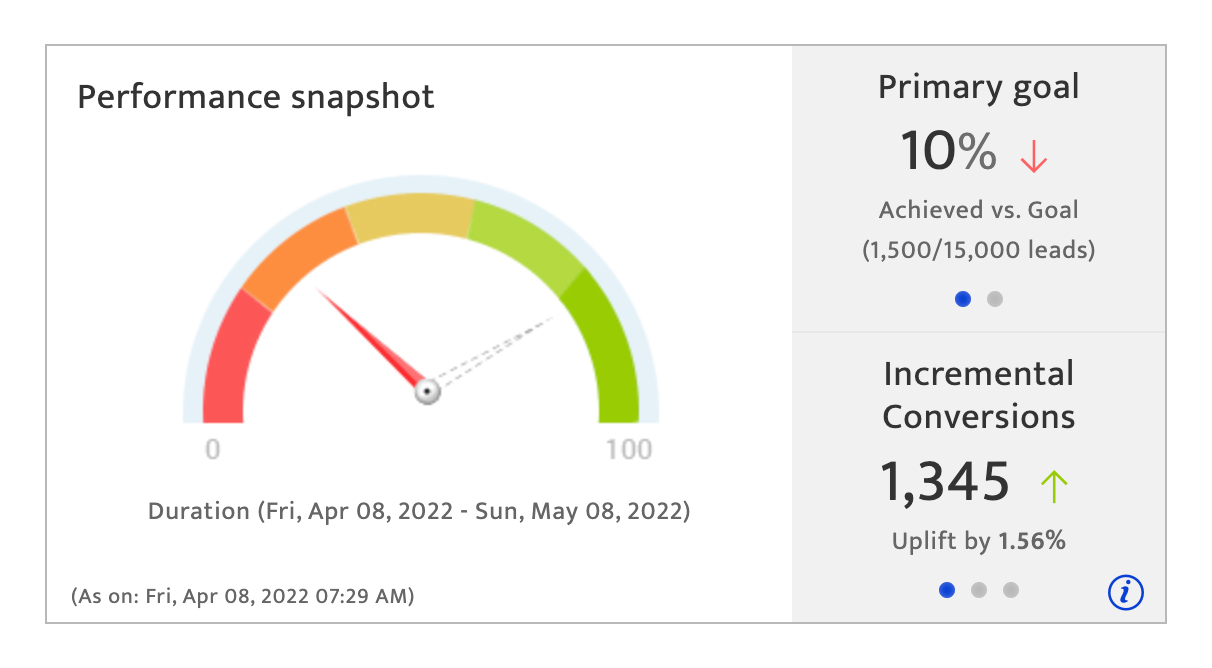
Using the performance snapshot section#
This section compares the primary and secondary targets against goals set. It also compares the actual ROI to the target ROI.
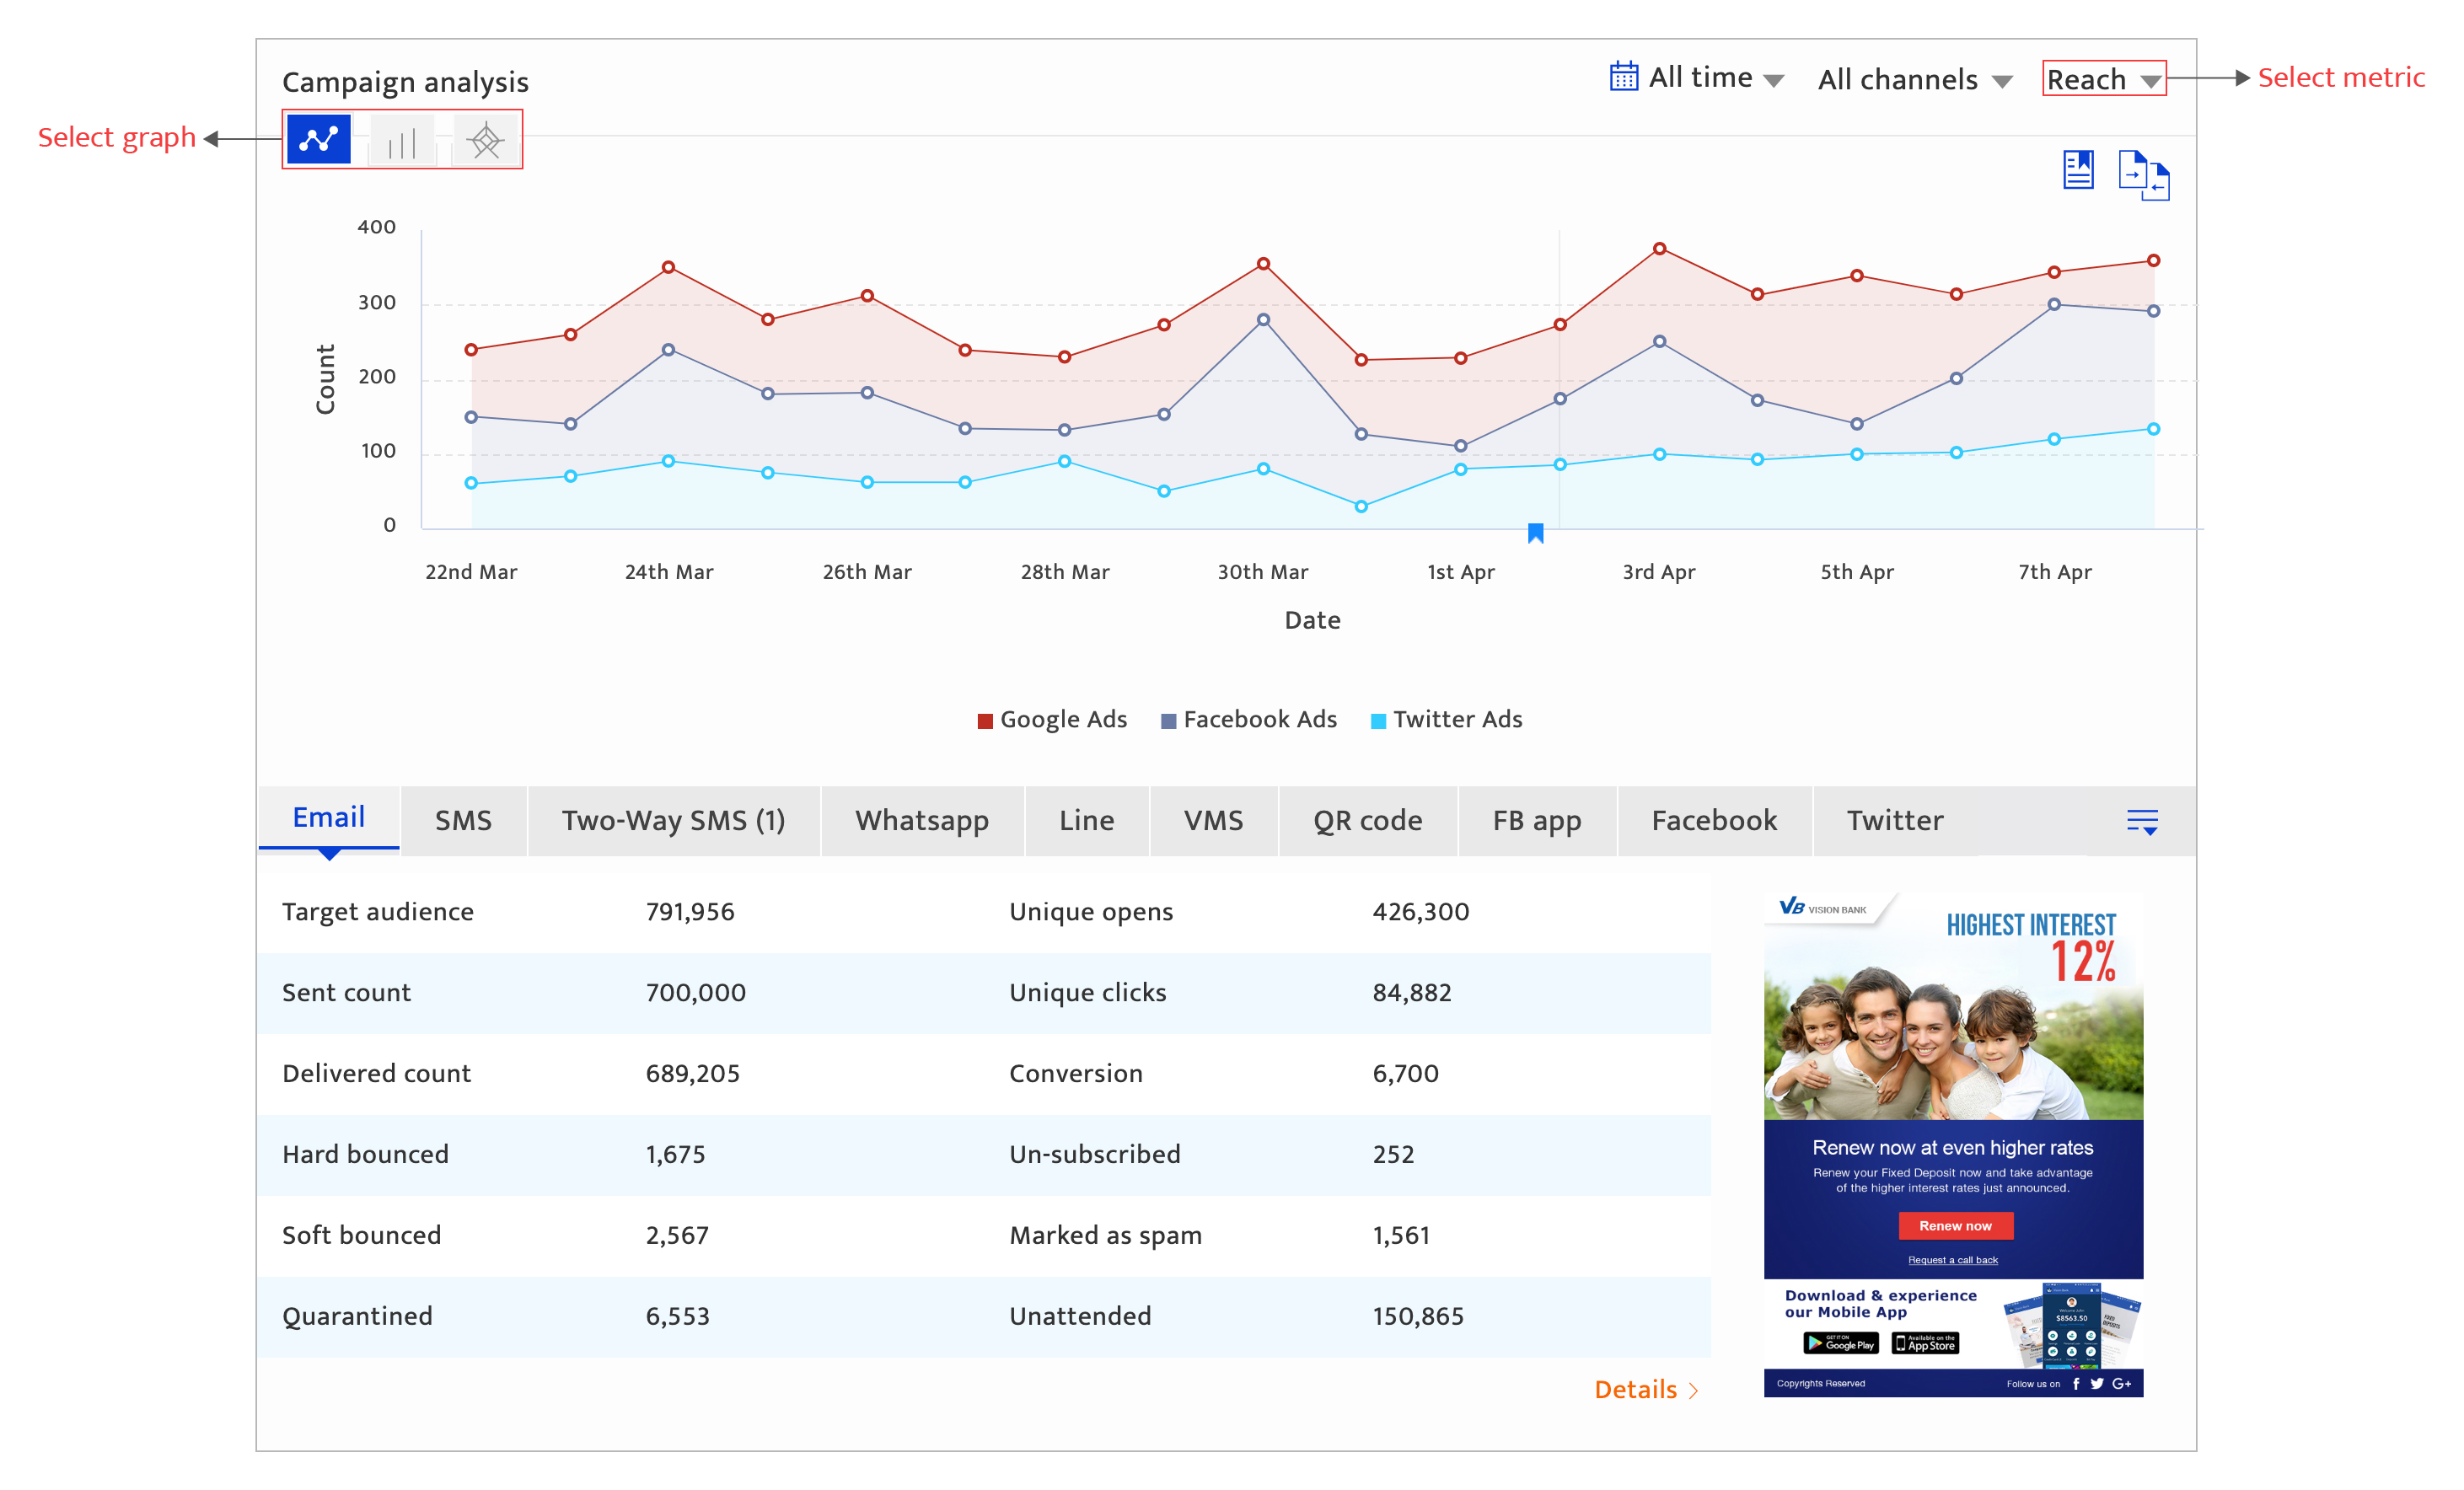
Using the campaign analysis section#
This section displays the campaign’s reach/engagement/conversion rates picked from a drop-down list on the right, using a line, radar or bar chart selected using the icon options on the left.
In the line chart view, click any point on the graph to insert a note, with a limit of 50-characters.
The user can click the channel-specific tabs to view the Detailed Analytics Report by channel.
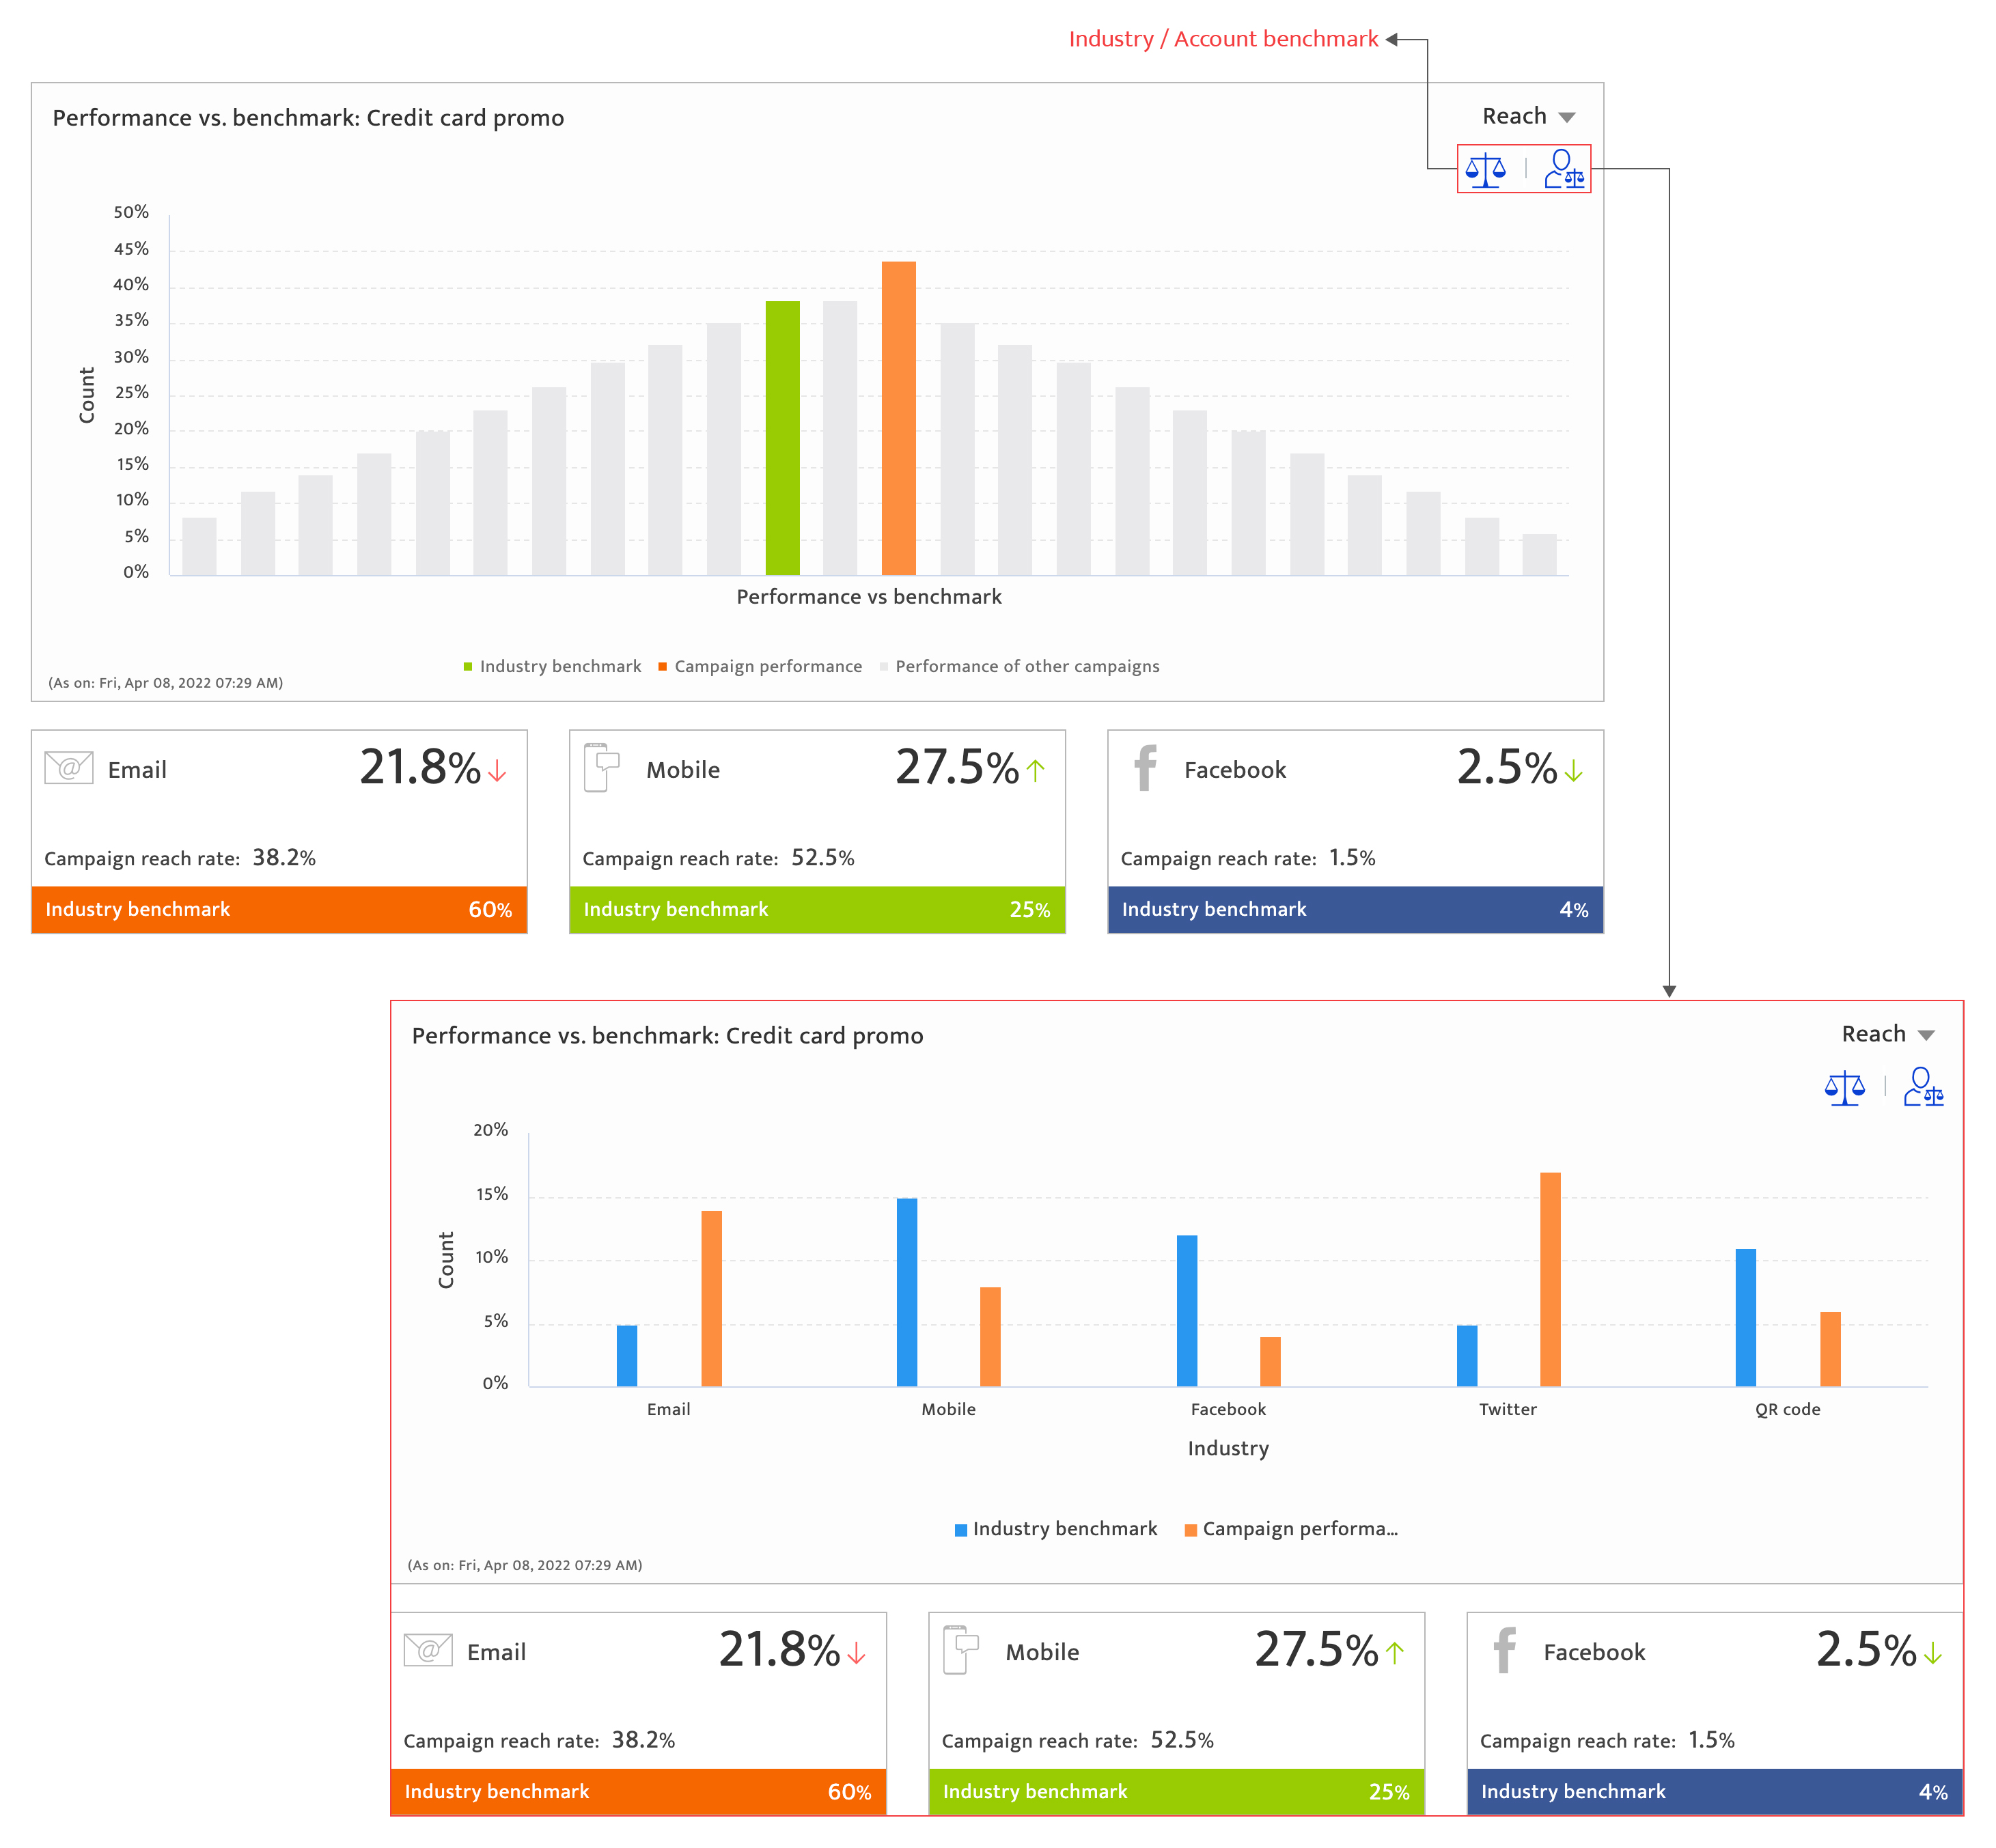
Using the benchmarking section#
This section compares the campaign performance against industry and the accounts own benchmarks, set under the Goals & Benchmarks section. Click on the appropriate icon on the top right corner of this section, to view
- How the campaign performed compared to the industry or account’s own benchmark and other campaigns deployed from the platform
- A channel-by-channel industry benchmark comparison