Detailed web analytics report
What is it?#
The detailed analytics report is an in-depth, real-time report documenting audience behaviour on the website as the result of a campaign. It includes key performance metrics relevant to the entire campaign starting from the first 24 hours and there onwards. The user has the option to filter the report results in a variety of ways.
Authorization and making changes#
Any user with campaign access can open the detailed analytics report.
Accessing detailed analytics report#
- Select the analytics module
- Select campaign analytics from the drop-down list.
- Select a campaign from the campaign list
- Click on the Analytics icon
- Scroll down to the Channel tabs, under the campaign analysis section of the report.
- Select the web/app tab and click on Details. If not listed as a tab, first select the option in the More Channels drop down.
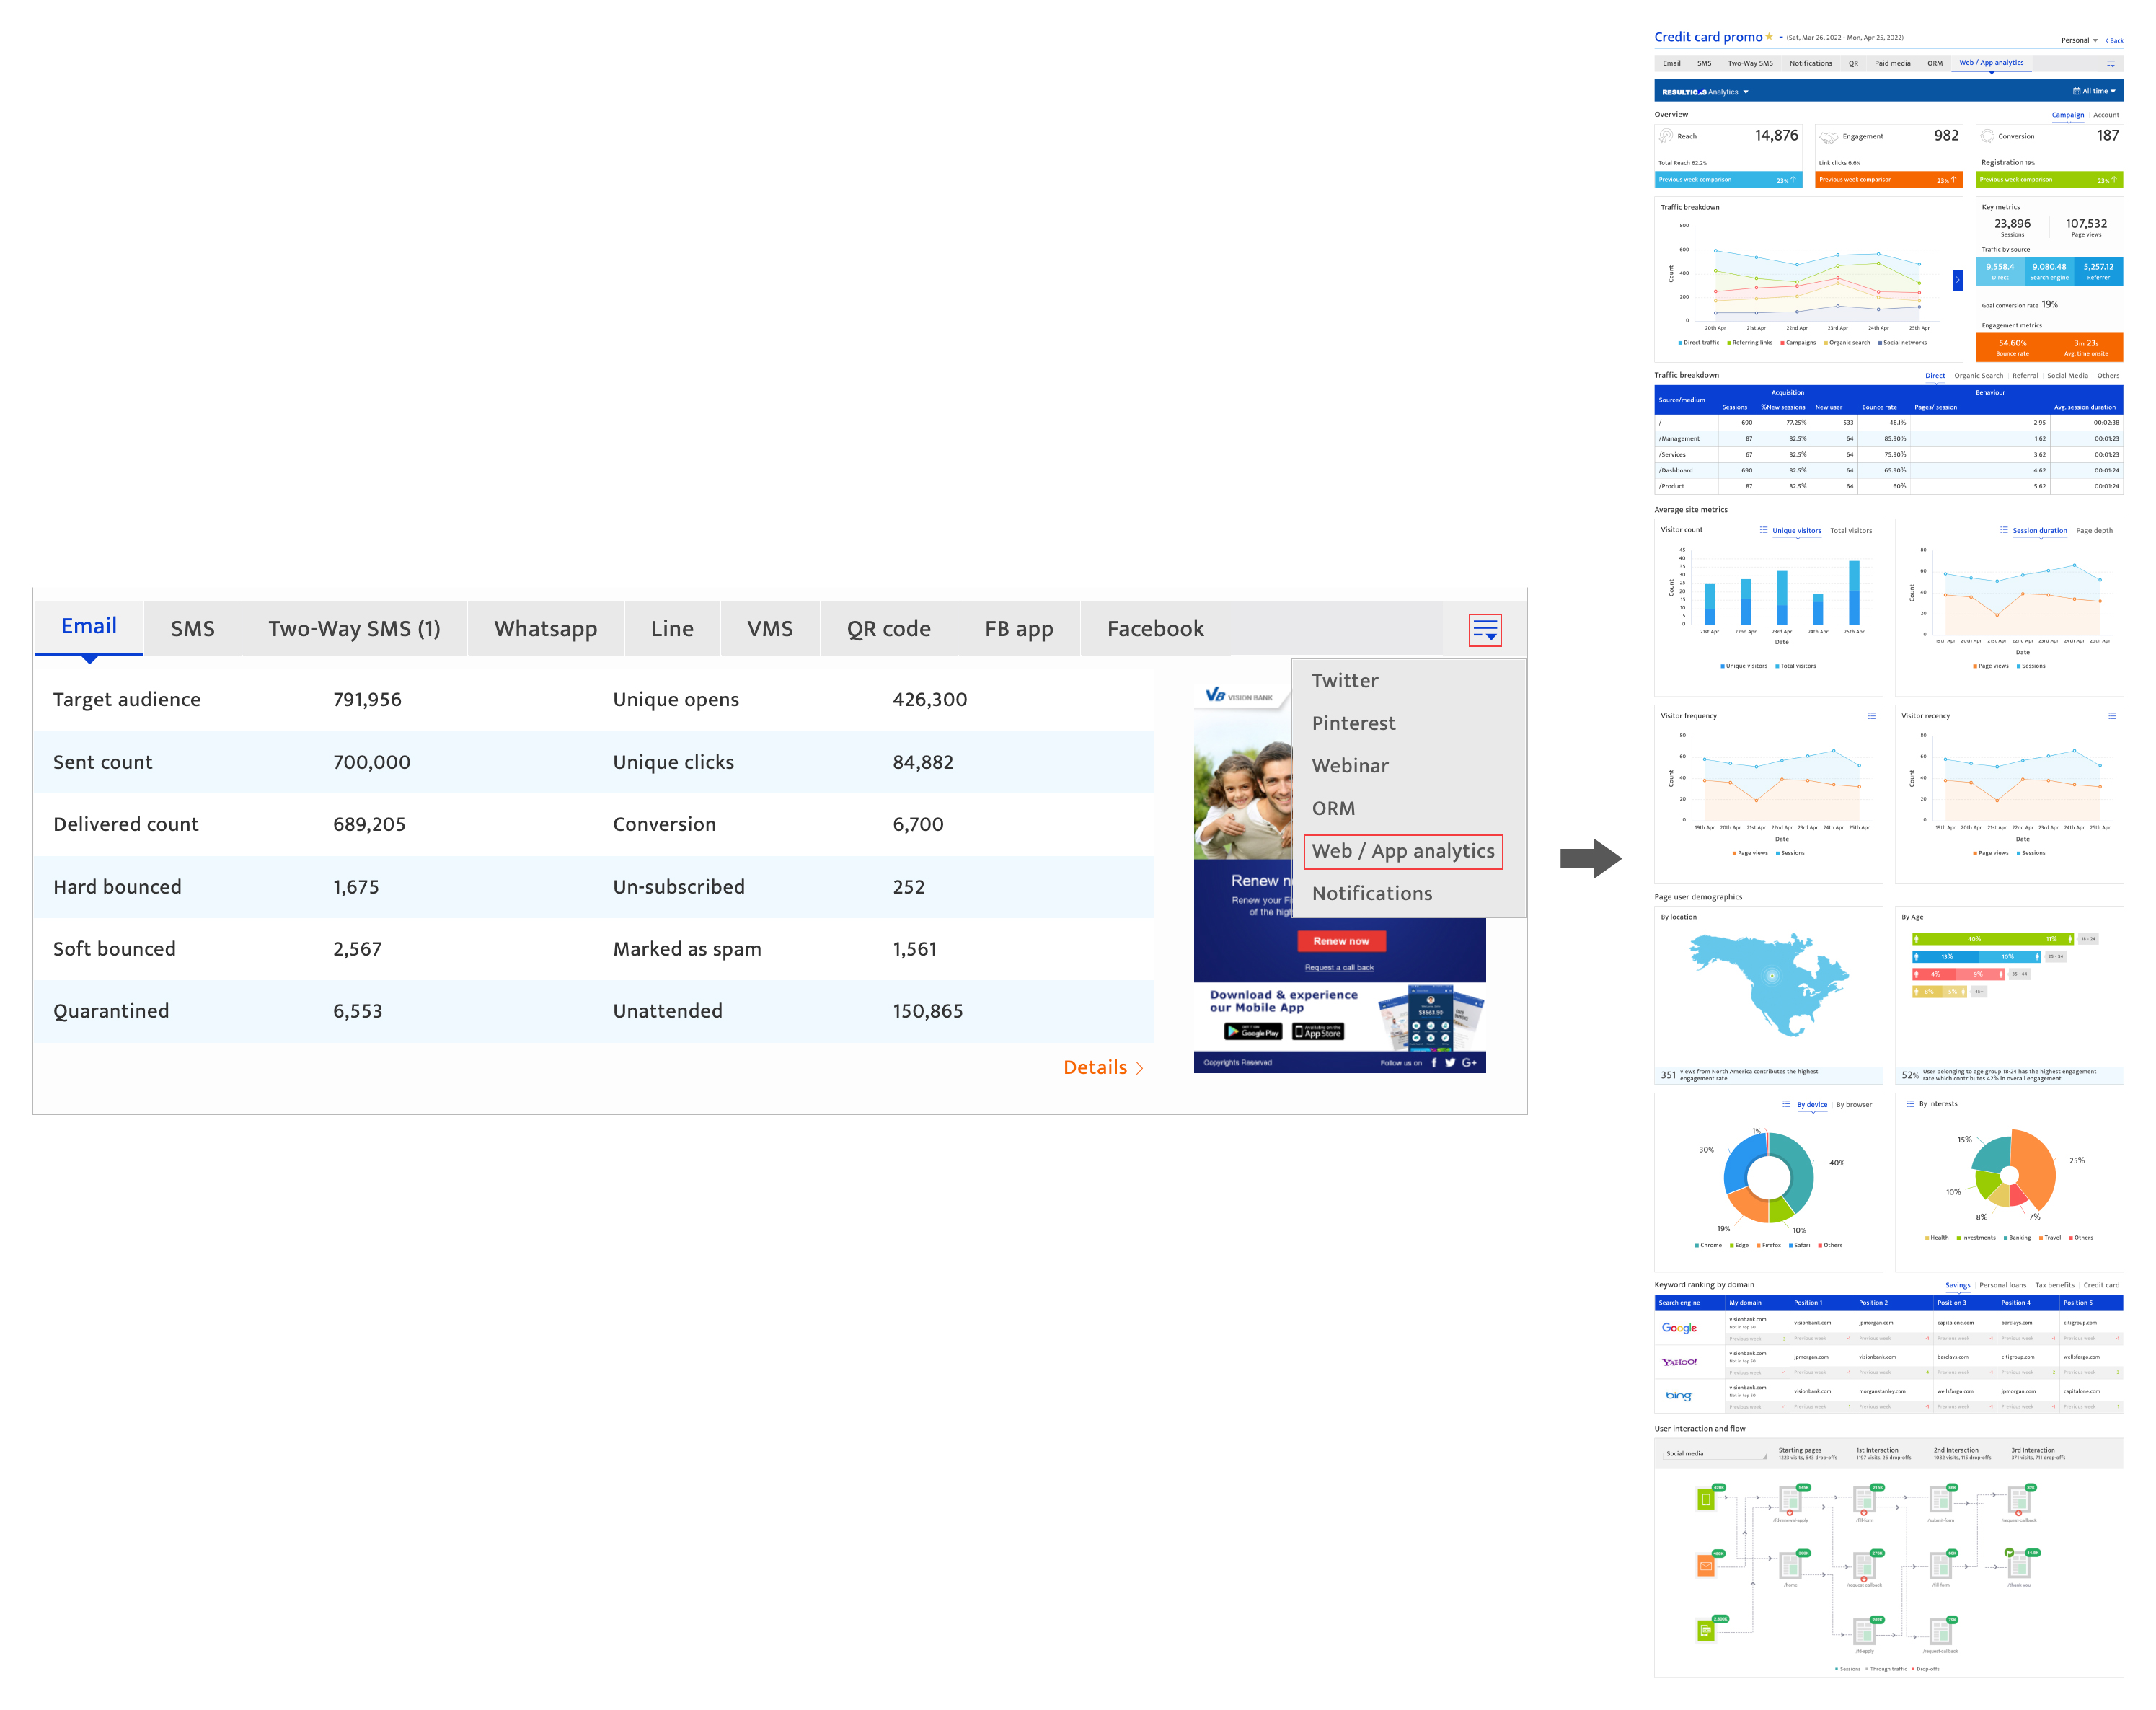
Exploring the web detailed analytics report#
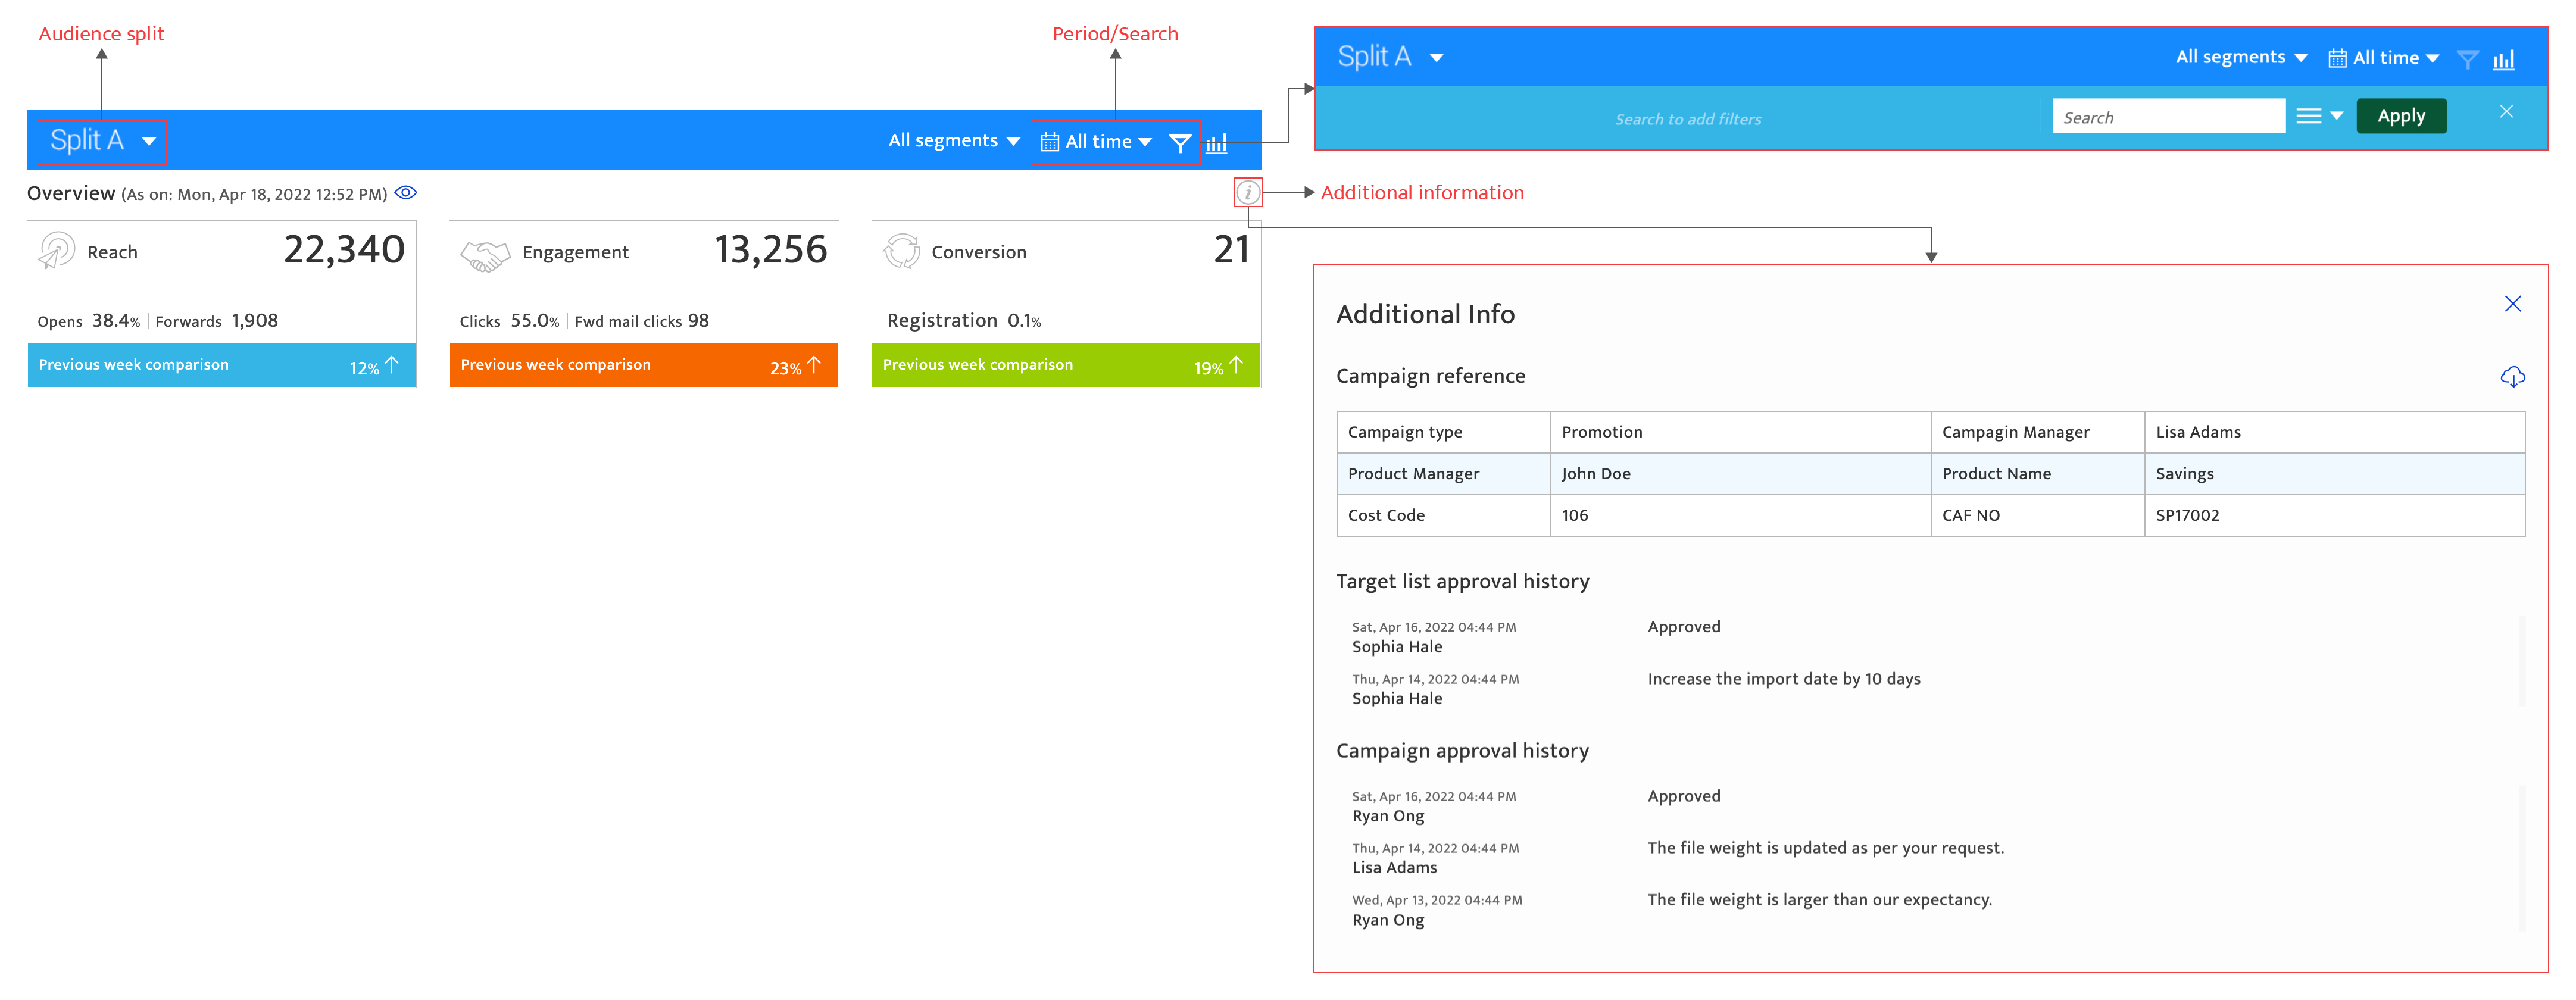
Common filters
- Analytics platform, that can be selected from the drop-down list at the top left corner, if configured during campaign creation. This will display the campaign report at the channel level for the corresponding analytics platform.
- Period, that uses the calendar to set the report period. The period must lie within the campaign duration.
- Advanced searches, that can be set by clicking the filter icon to open advanced searches, selecting a filter type and entering a value based on type selected. Click the Apply button to filter the report display. Multiple filters of different types can be added.
- User can also download a PDF file of the detailed analytics report by clicking on download icon (next to Advance search)
- Click the information icon to access additional campaign information that consists of the campaign reference and the approval histories of both the campaign and the target list used.
Traffic breakdown#
- Traffic breakdown by source
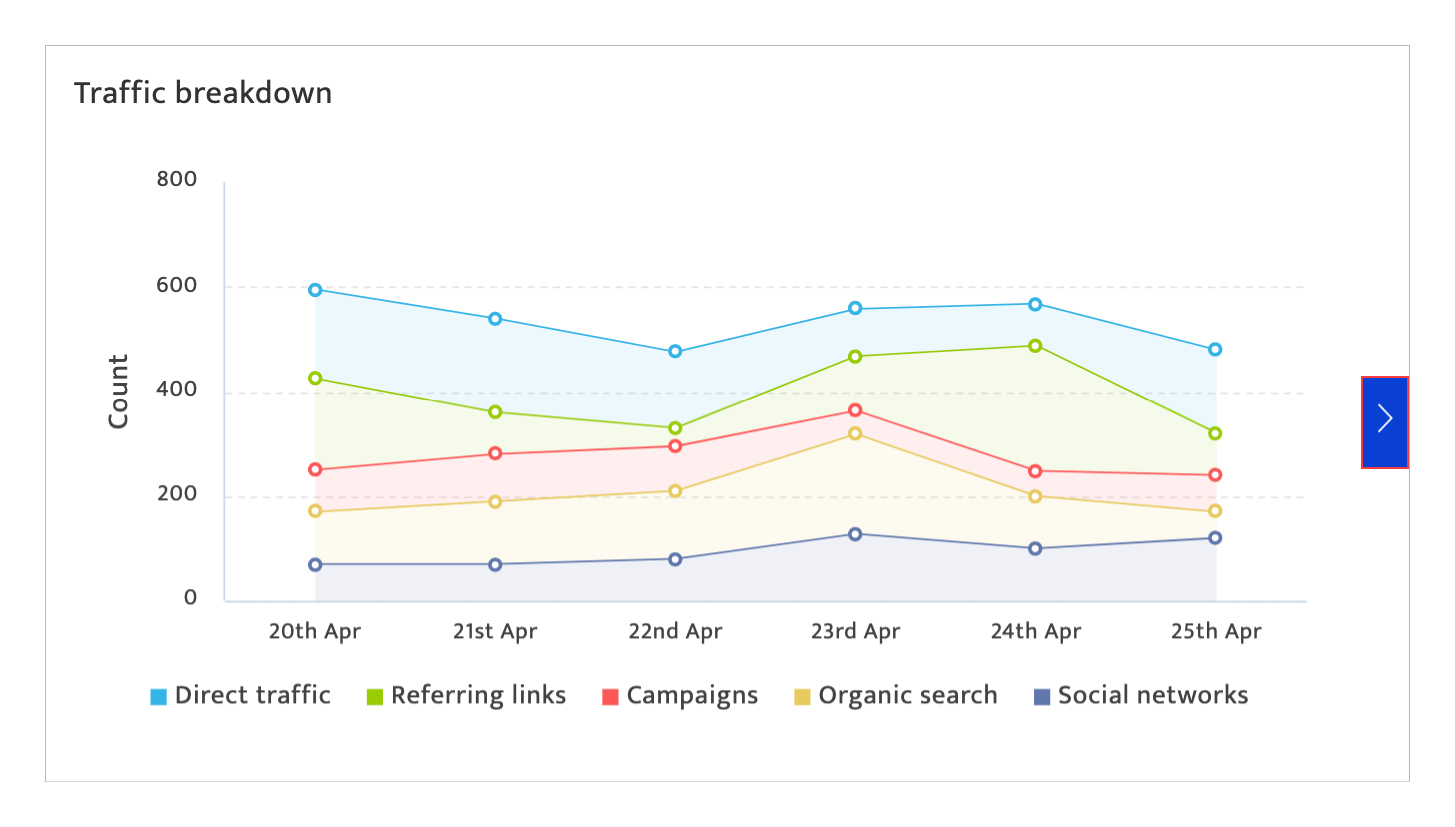
- Traffic breakdown – Grid view
- Sessions
- % New sessions
- New user
- Bounce rate
- Pages/ session
- Avg. session duration
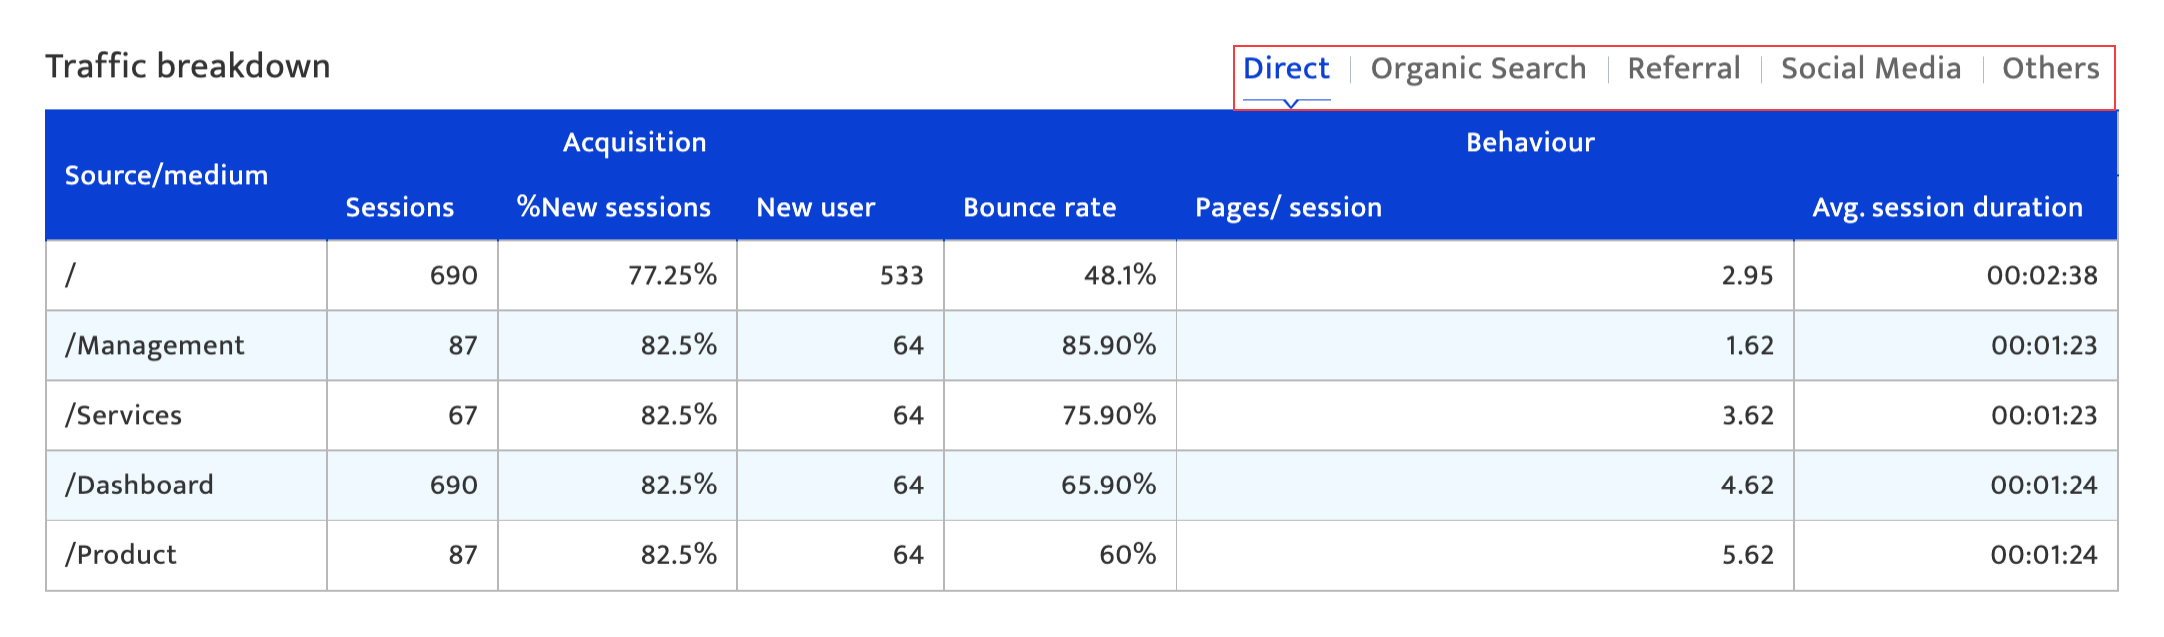
To switch between sources, click on the source tab that you would like to view this information for.
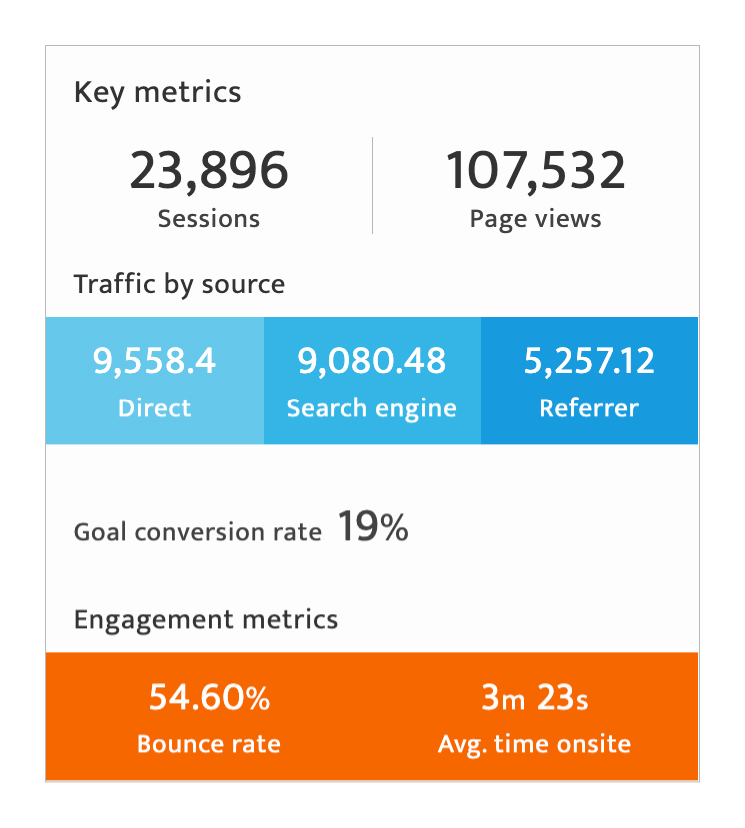
Key metrics#
The key metrics displayed here include:
- Sessions
- Pageviews
- Goal conversation rate
- Engagement metrics – average time onsite/session, Bounce rate
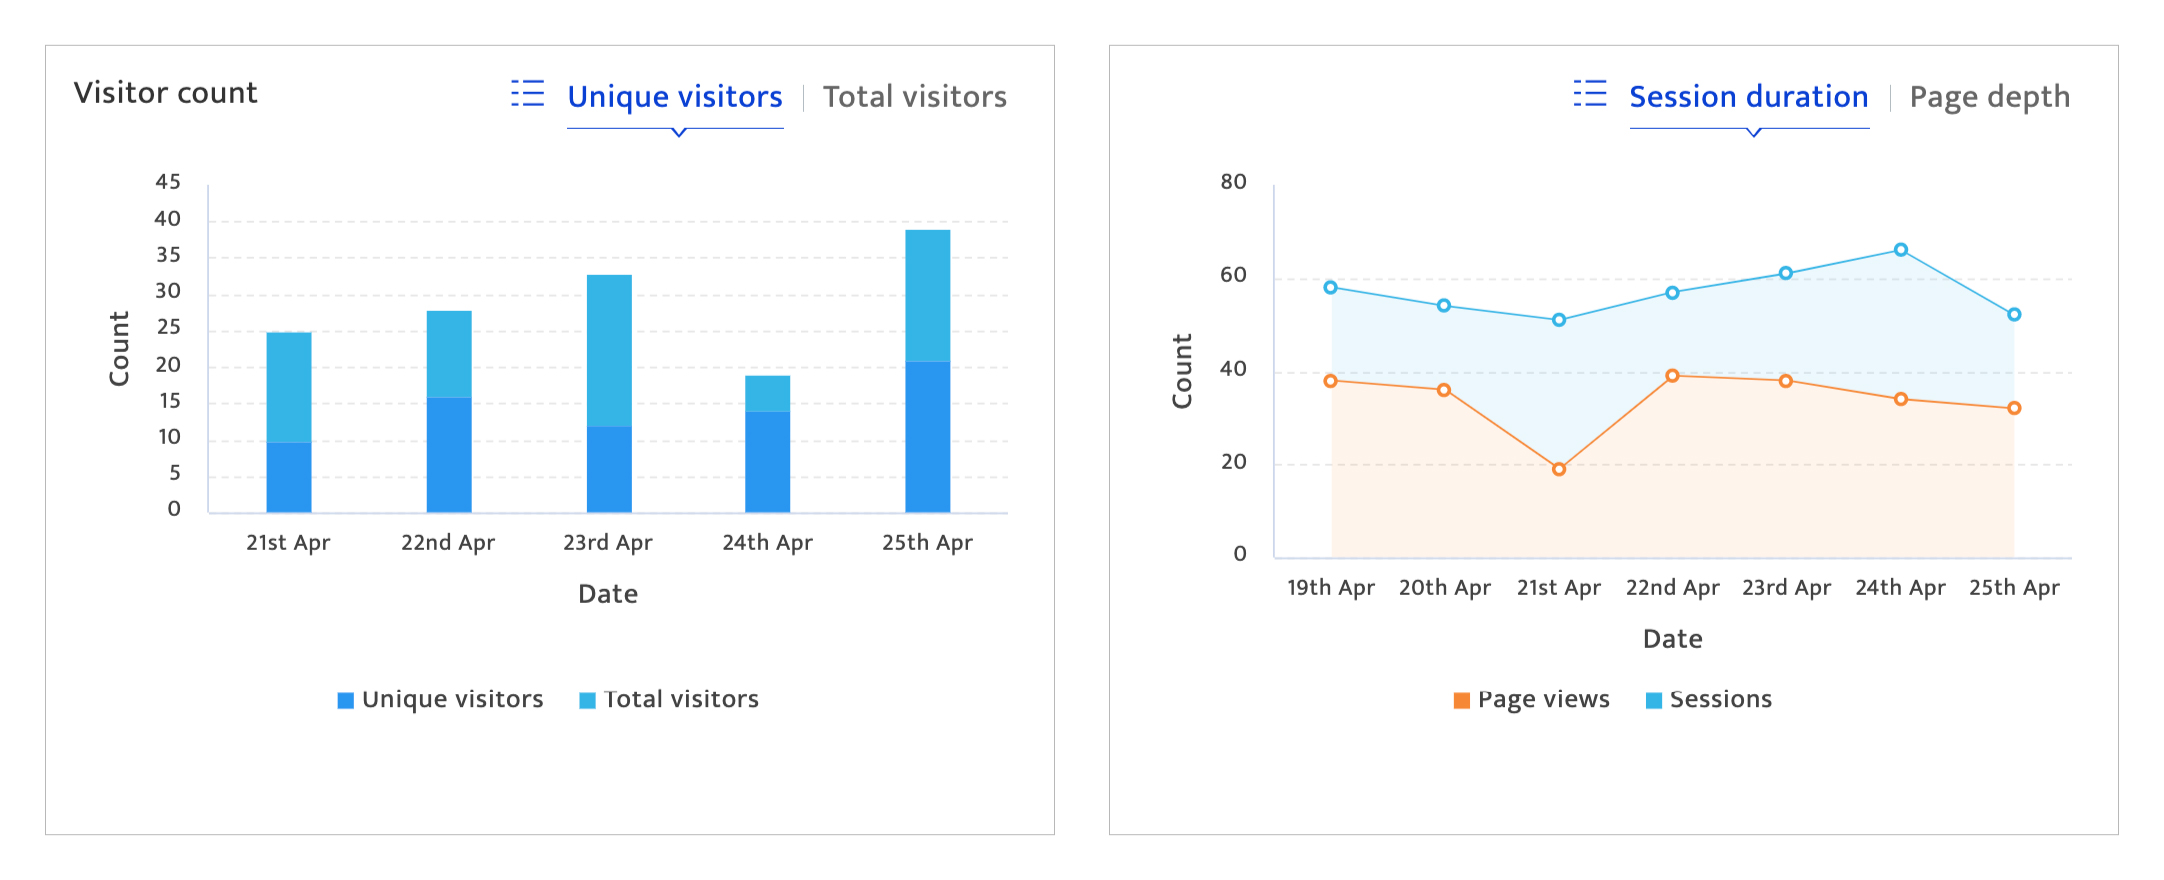
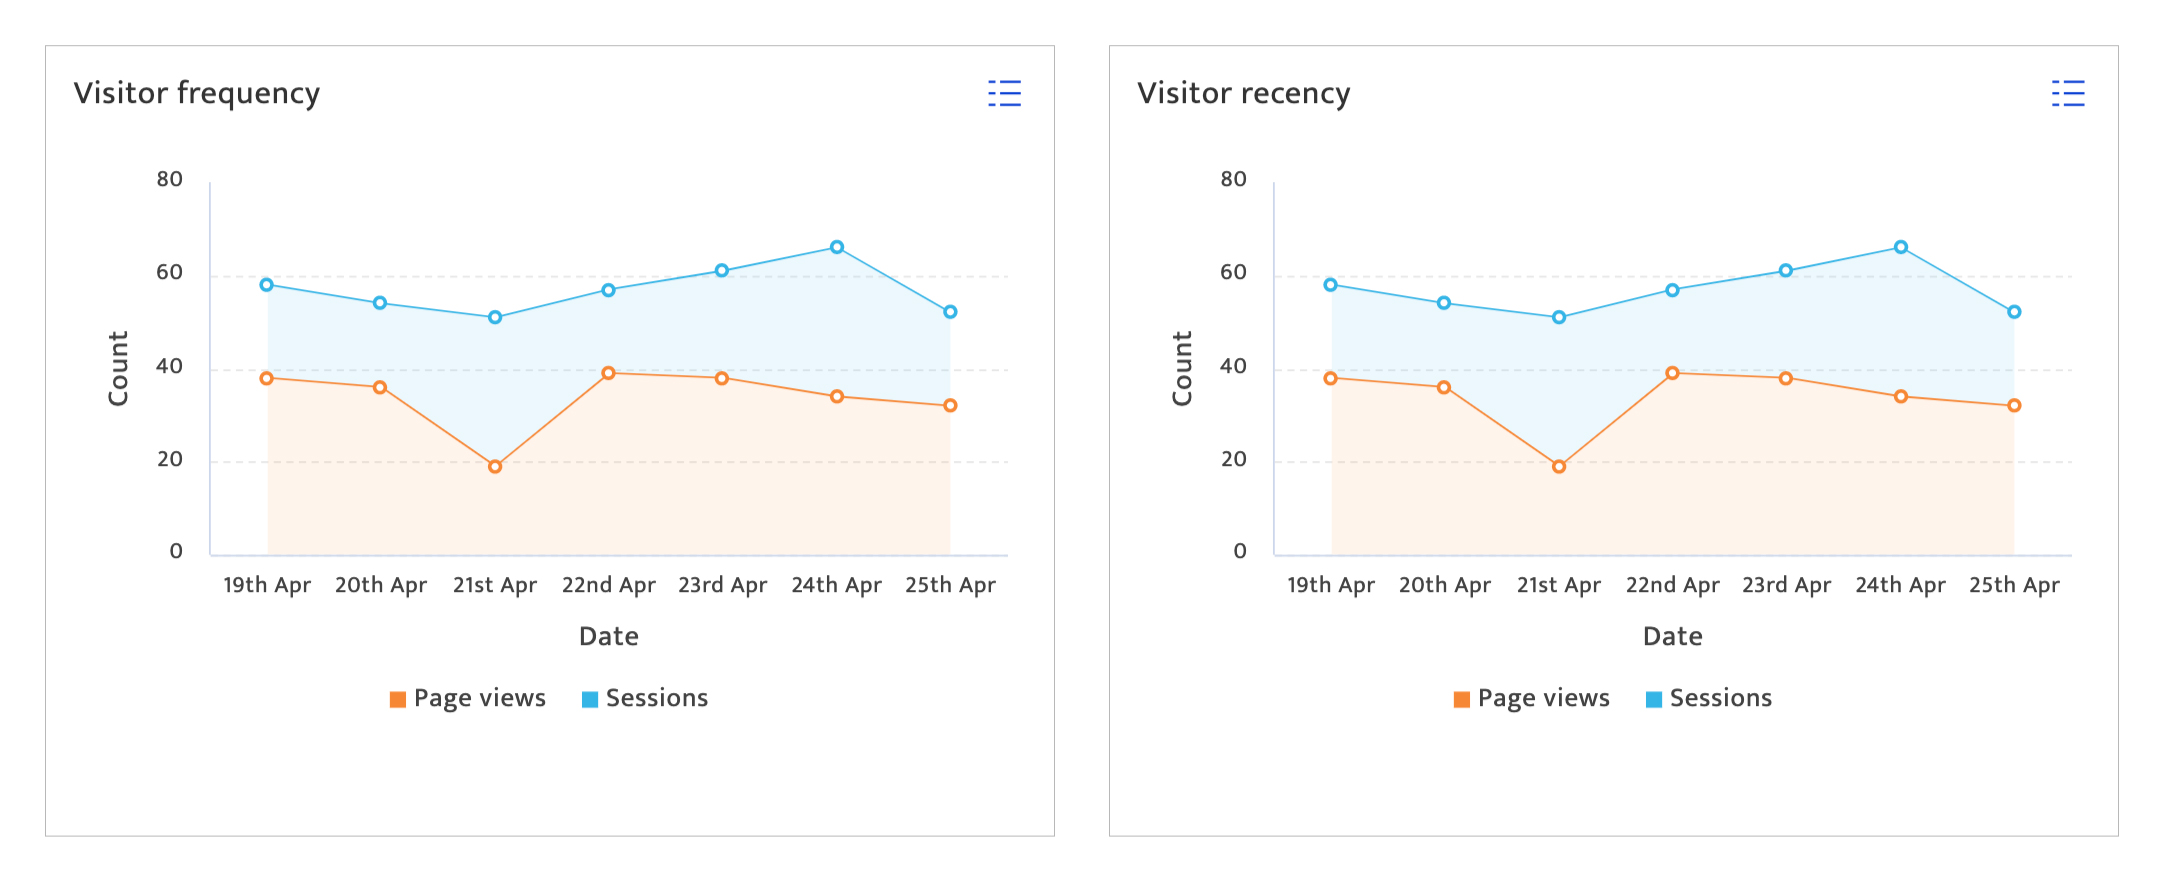
Average site metrics#
This section documents user visits to the site. The information here includes:
- Total and unique visitor counts broken down by user type
- Daily average session time and page depth
- Visitor frequency and recency broken down by page views and sessions
Page user demographics#
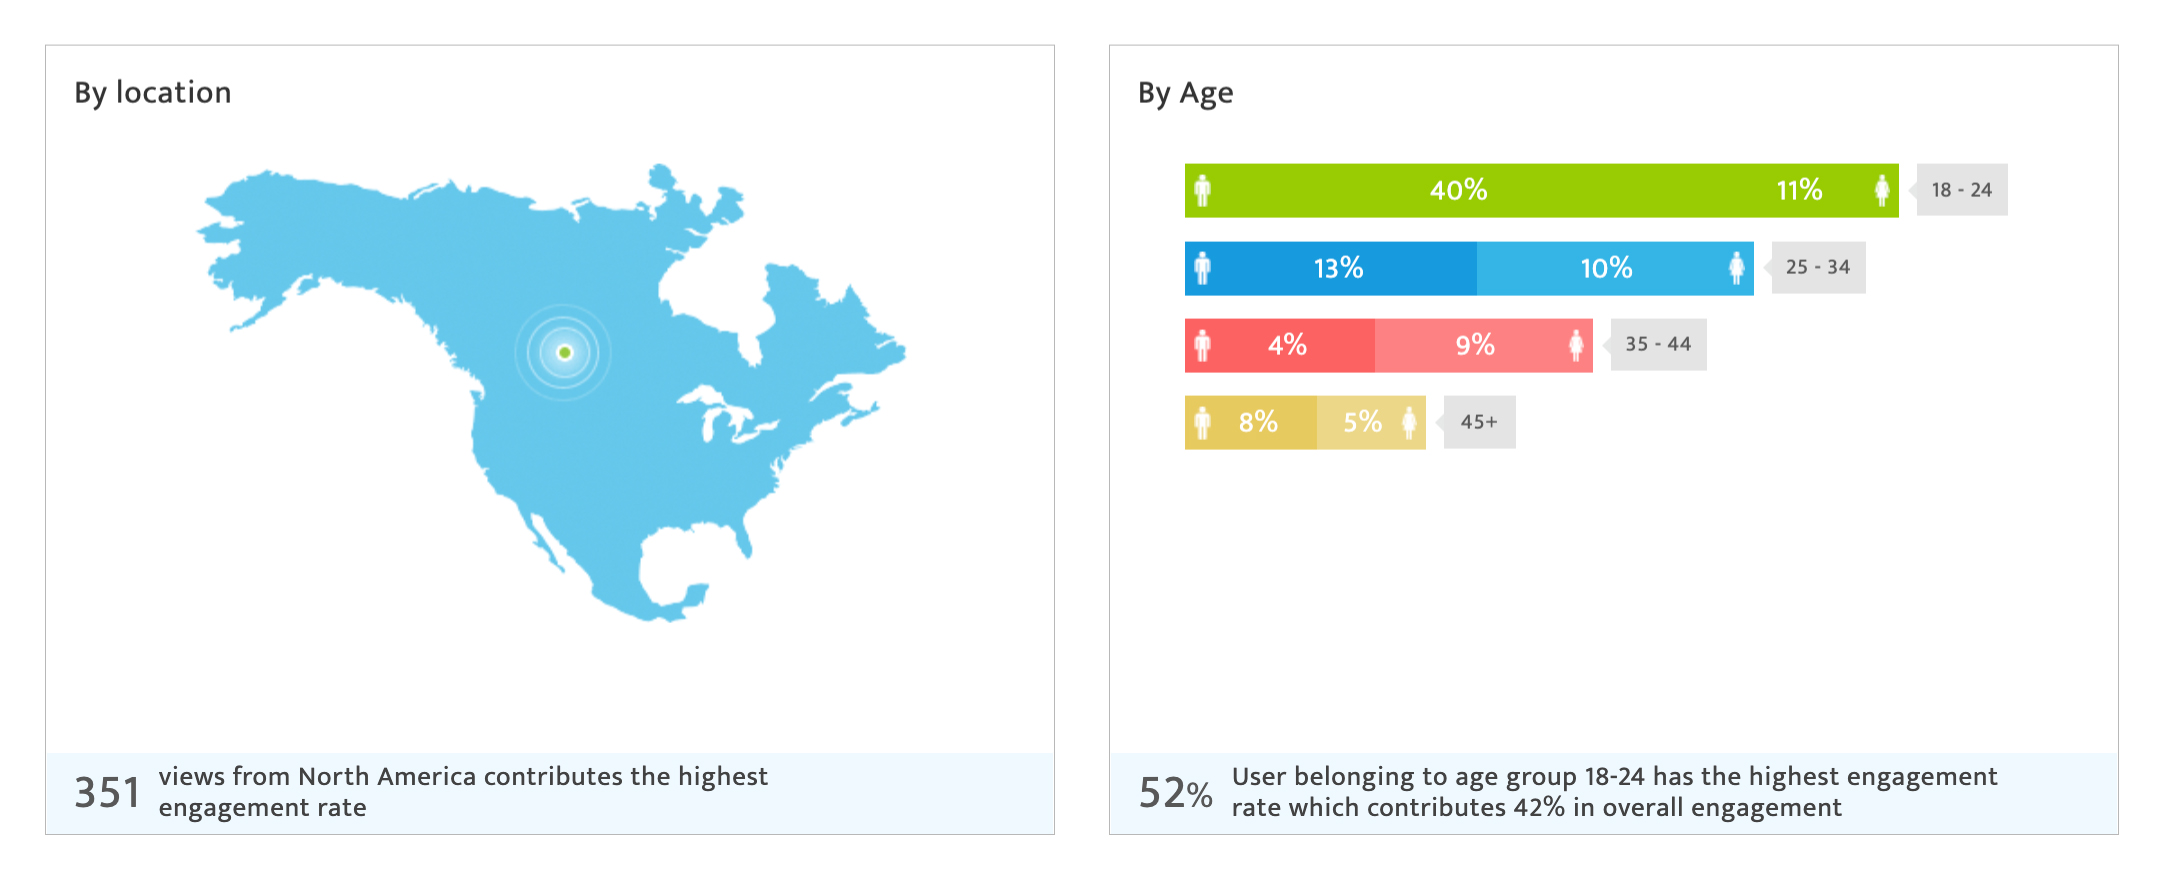
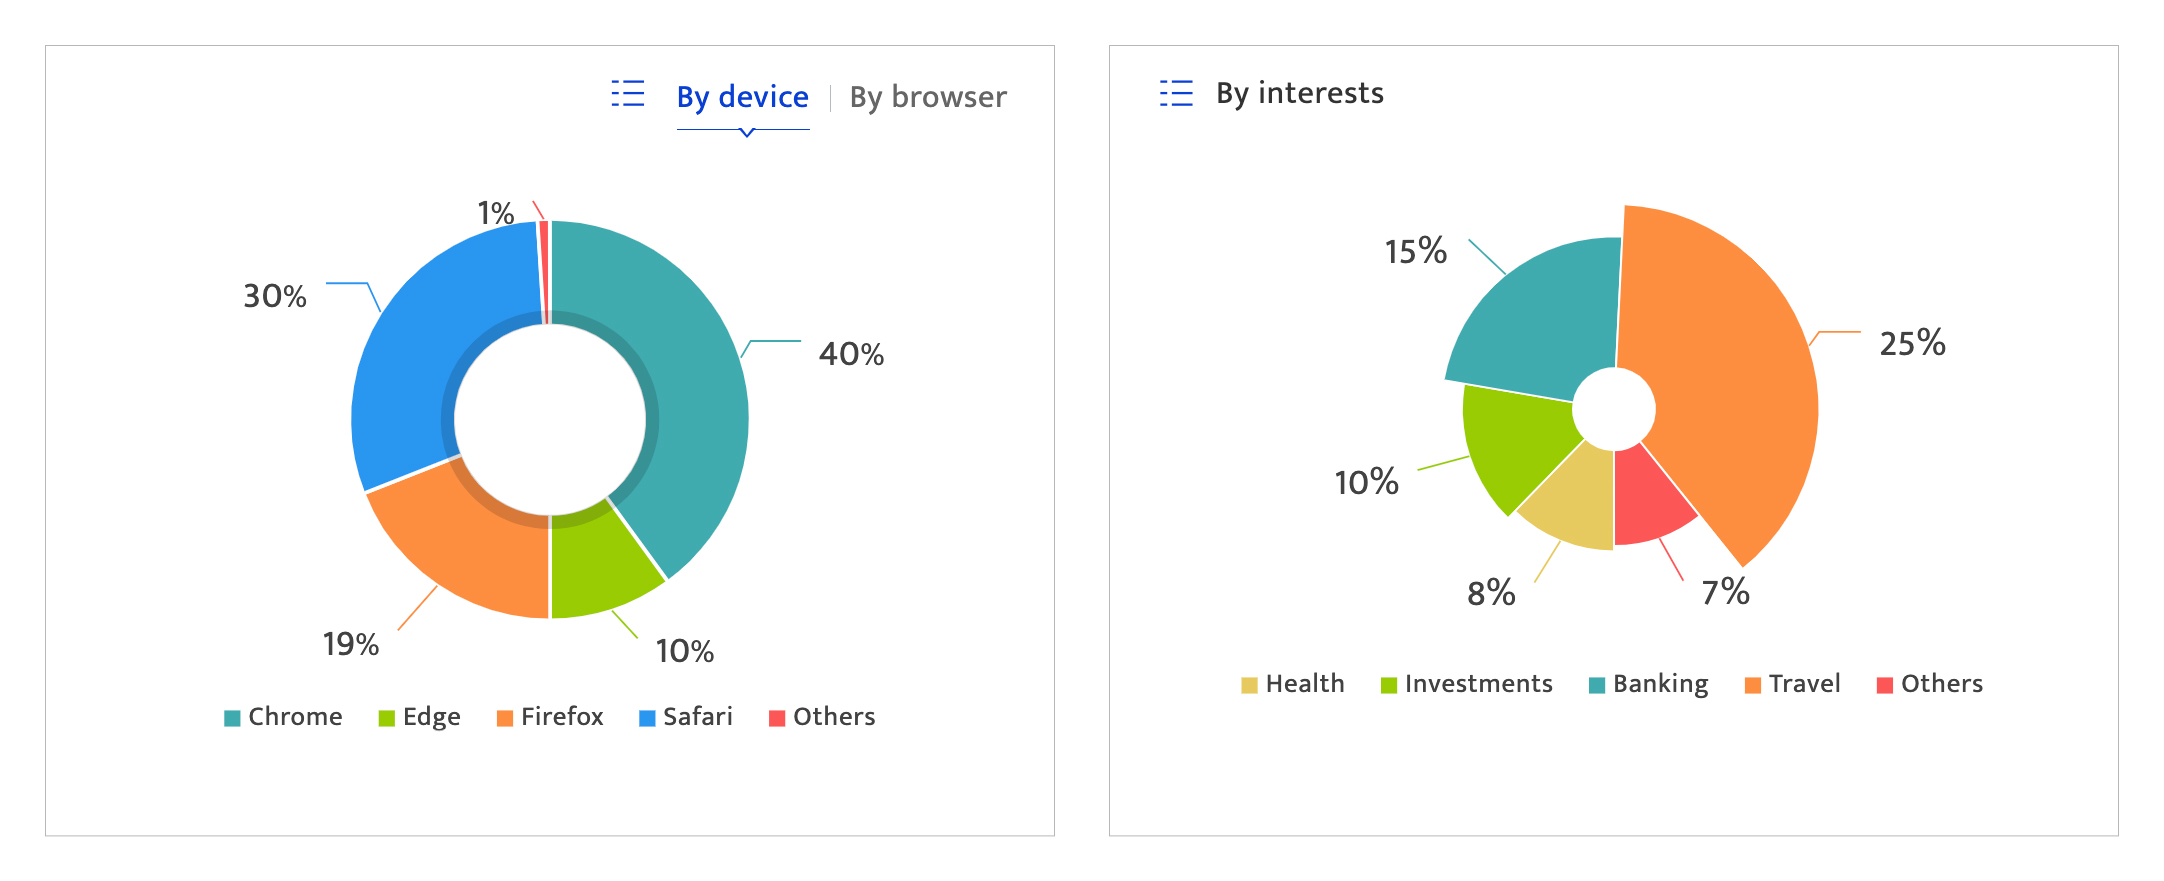
This section documents the attributes of visitors to the site. The information here includes:
- Location or geography from which the website visitors are originating
- Age-wise breakdown (which is further broken down into gender) of the total website visitors
- Device/browser used by the website visitors
- Interests as indicated of the website visitors
Keyword ranking by domain#
This section documents the top searched keywords by domain.
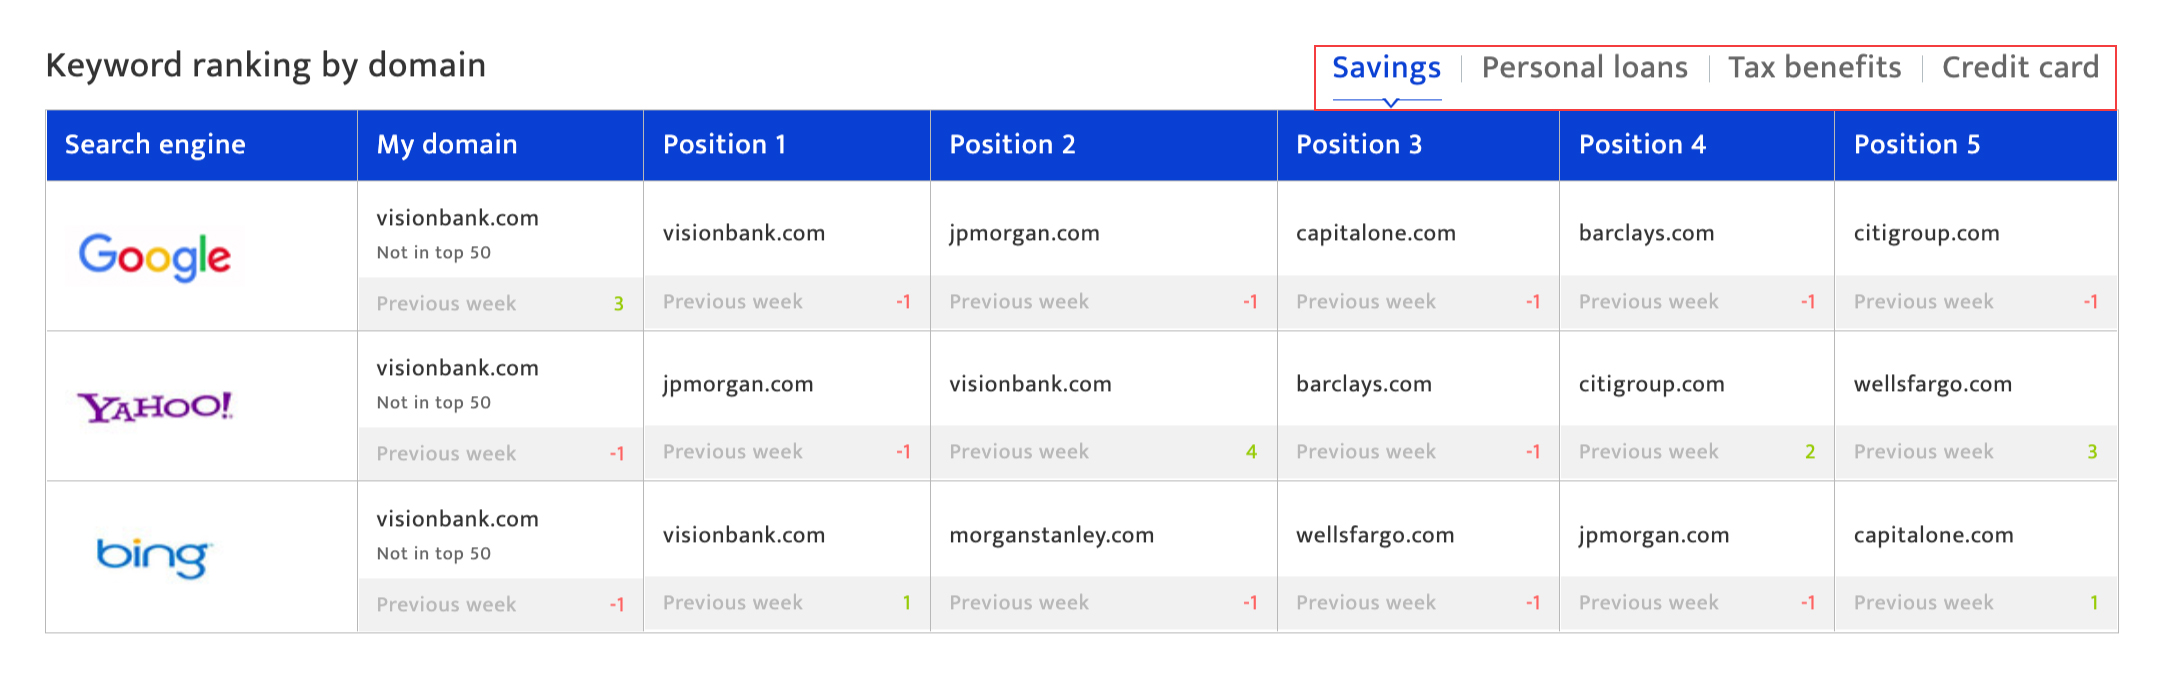
To switch between keywords, click on the keywords tab that you would like to view this information for.
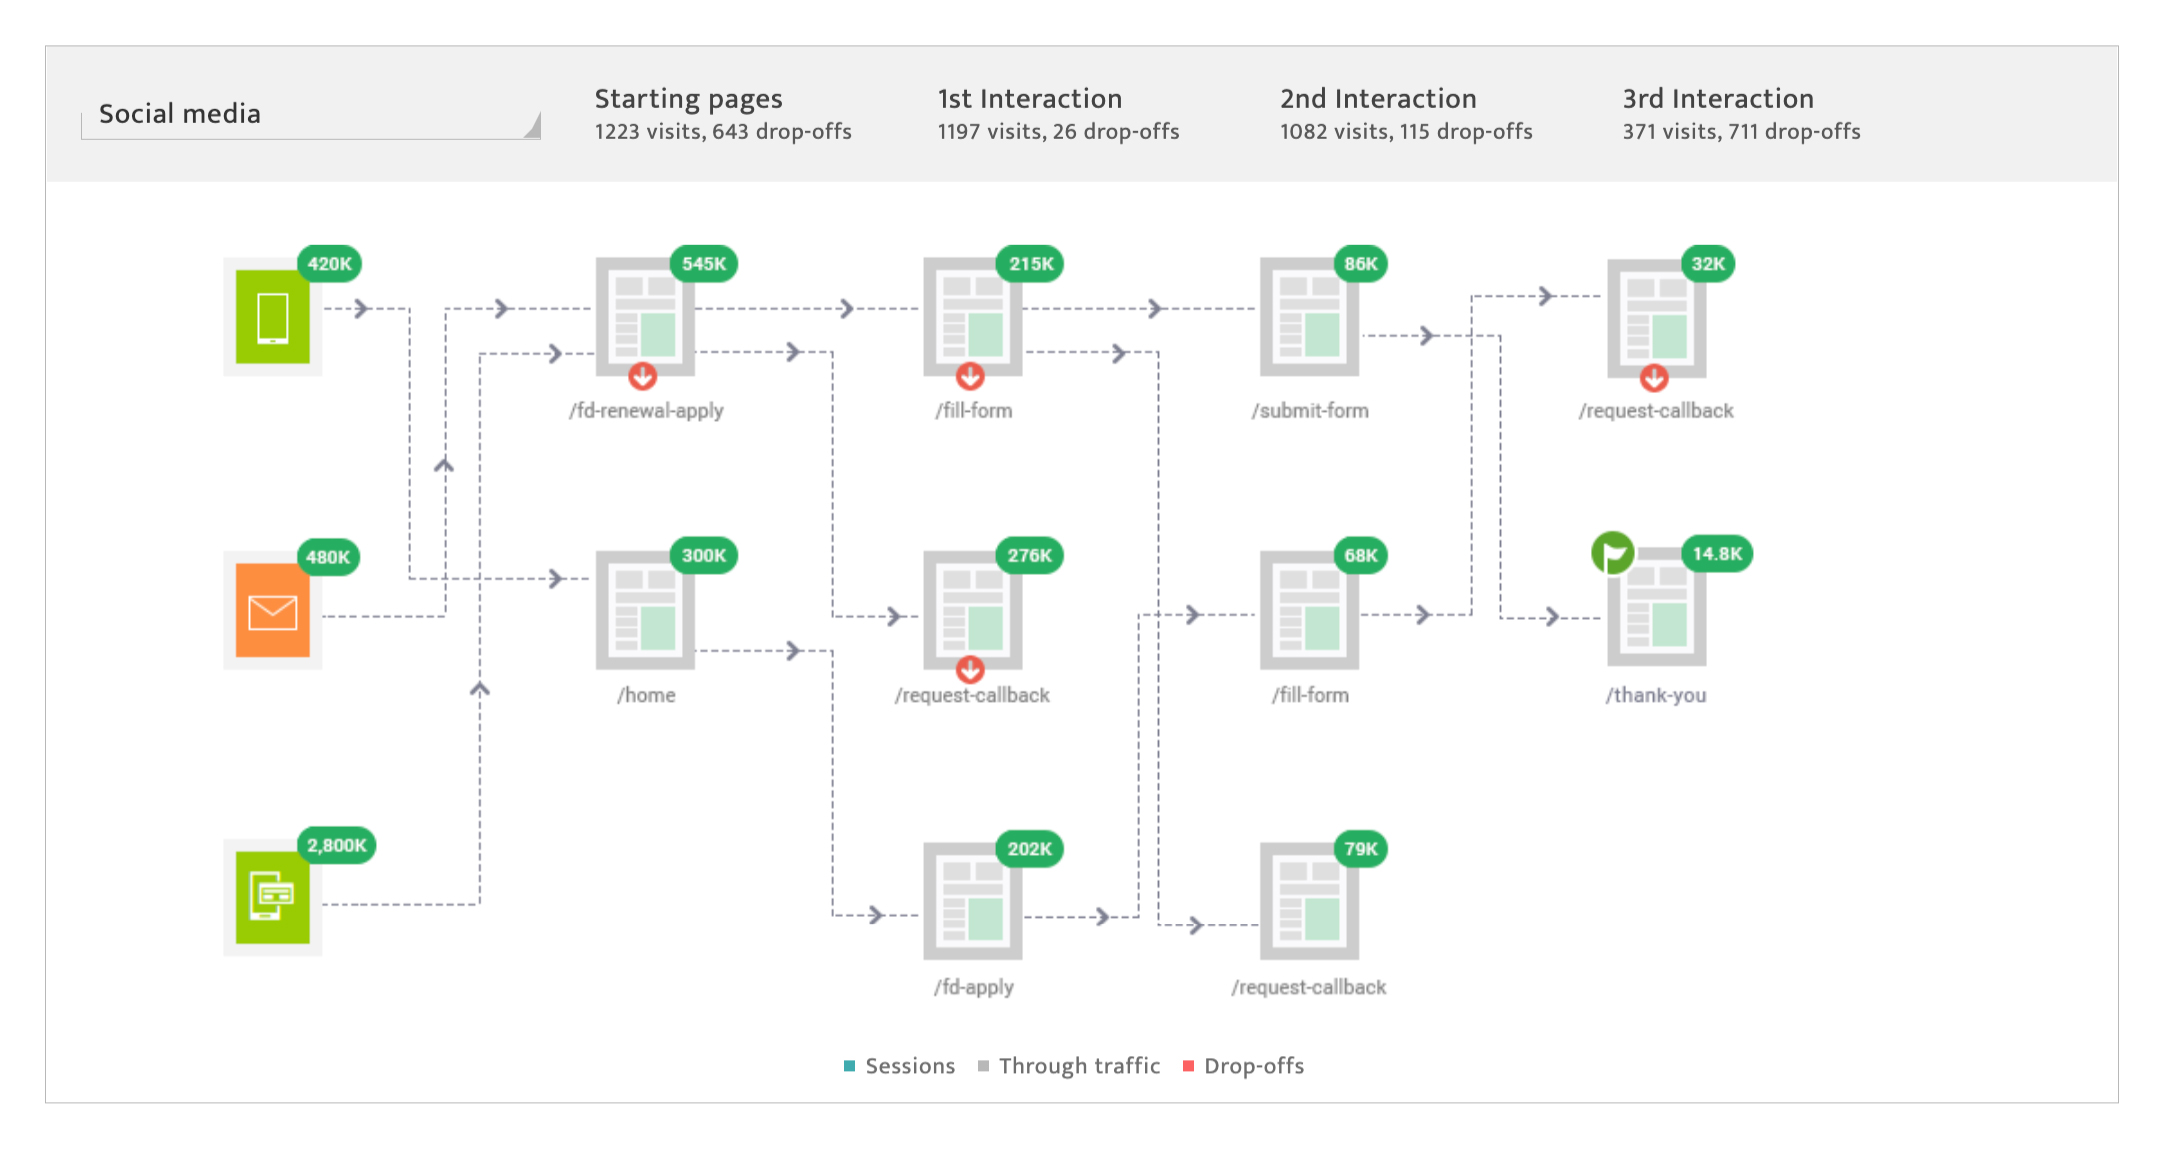
User interaction flow#
This section documents all the journeys that have been recorded as a result of this campaign execution on the website.. Key metrics displayed in this section include:
- The originating channel or touchpoint of the journeys
- Number of visitors/users at each interaction point of the journey
- Number of users dropping off at every stage of the journey.
- Point of conversion of the journeys with the number of visitors who converted