Detailed analytics report
What is it?#
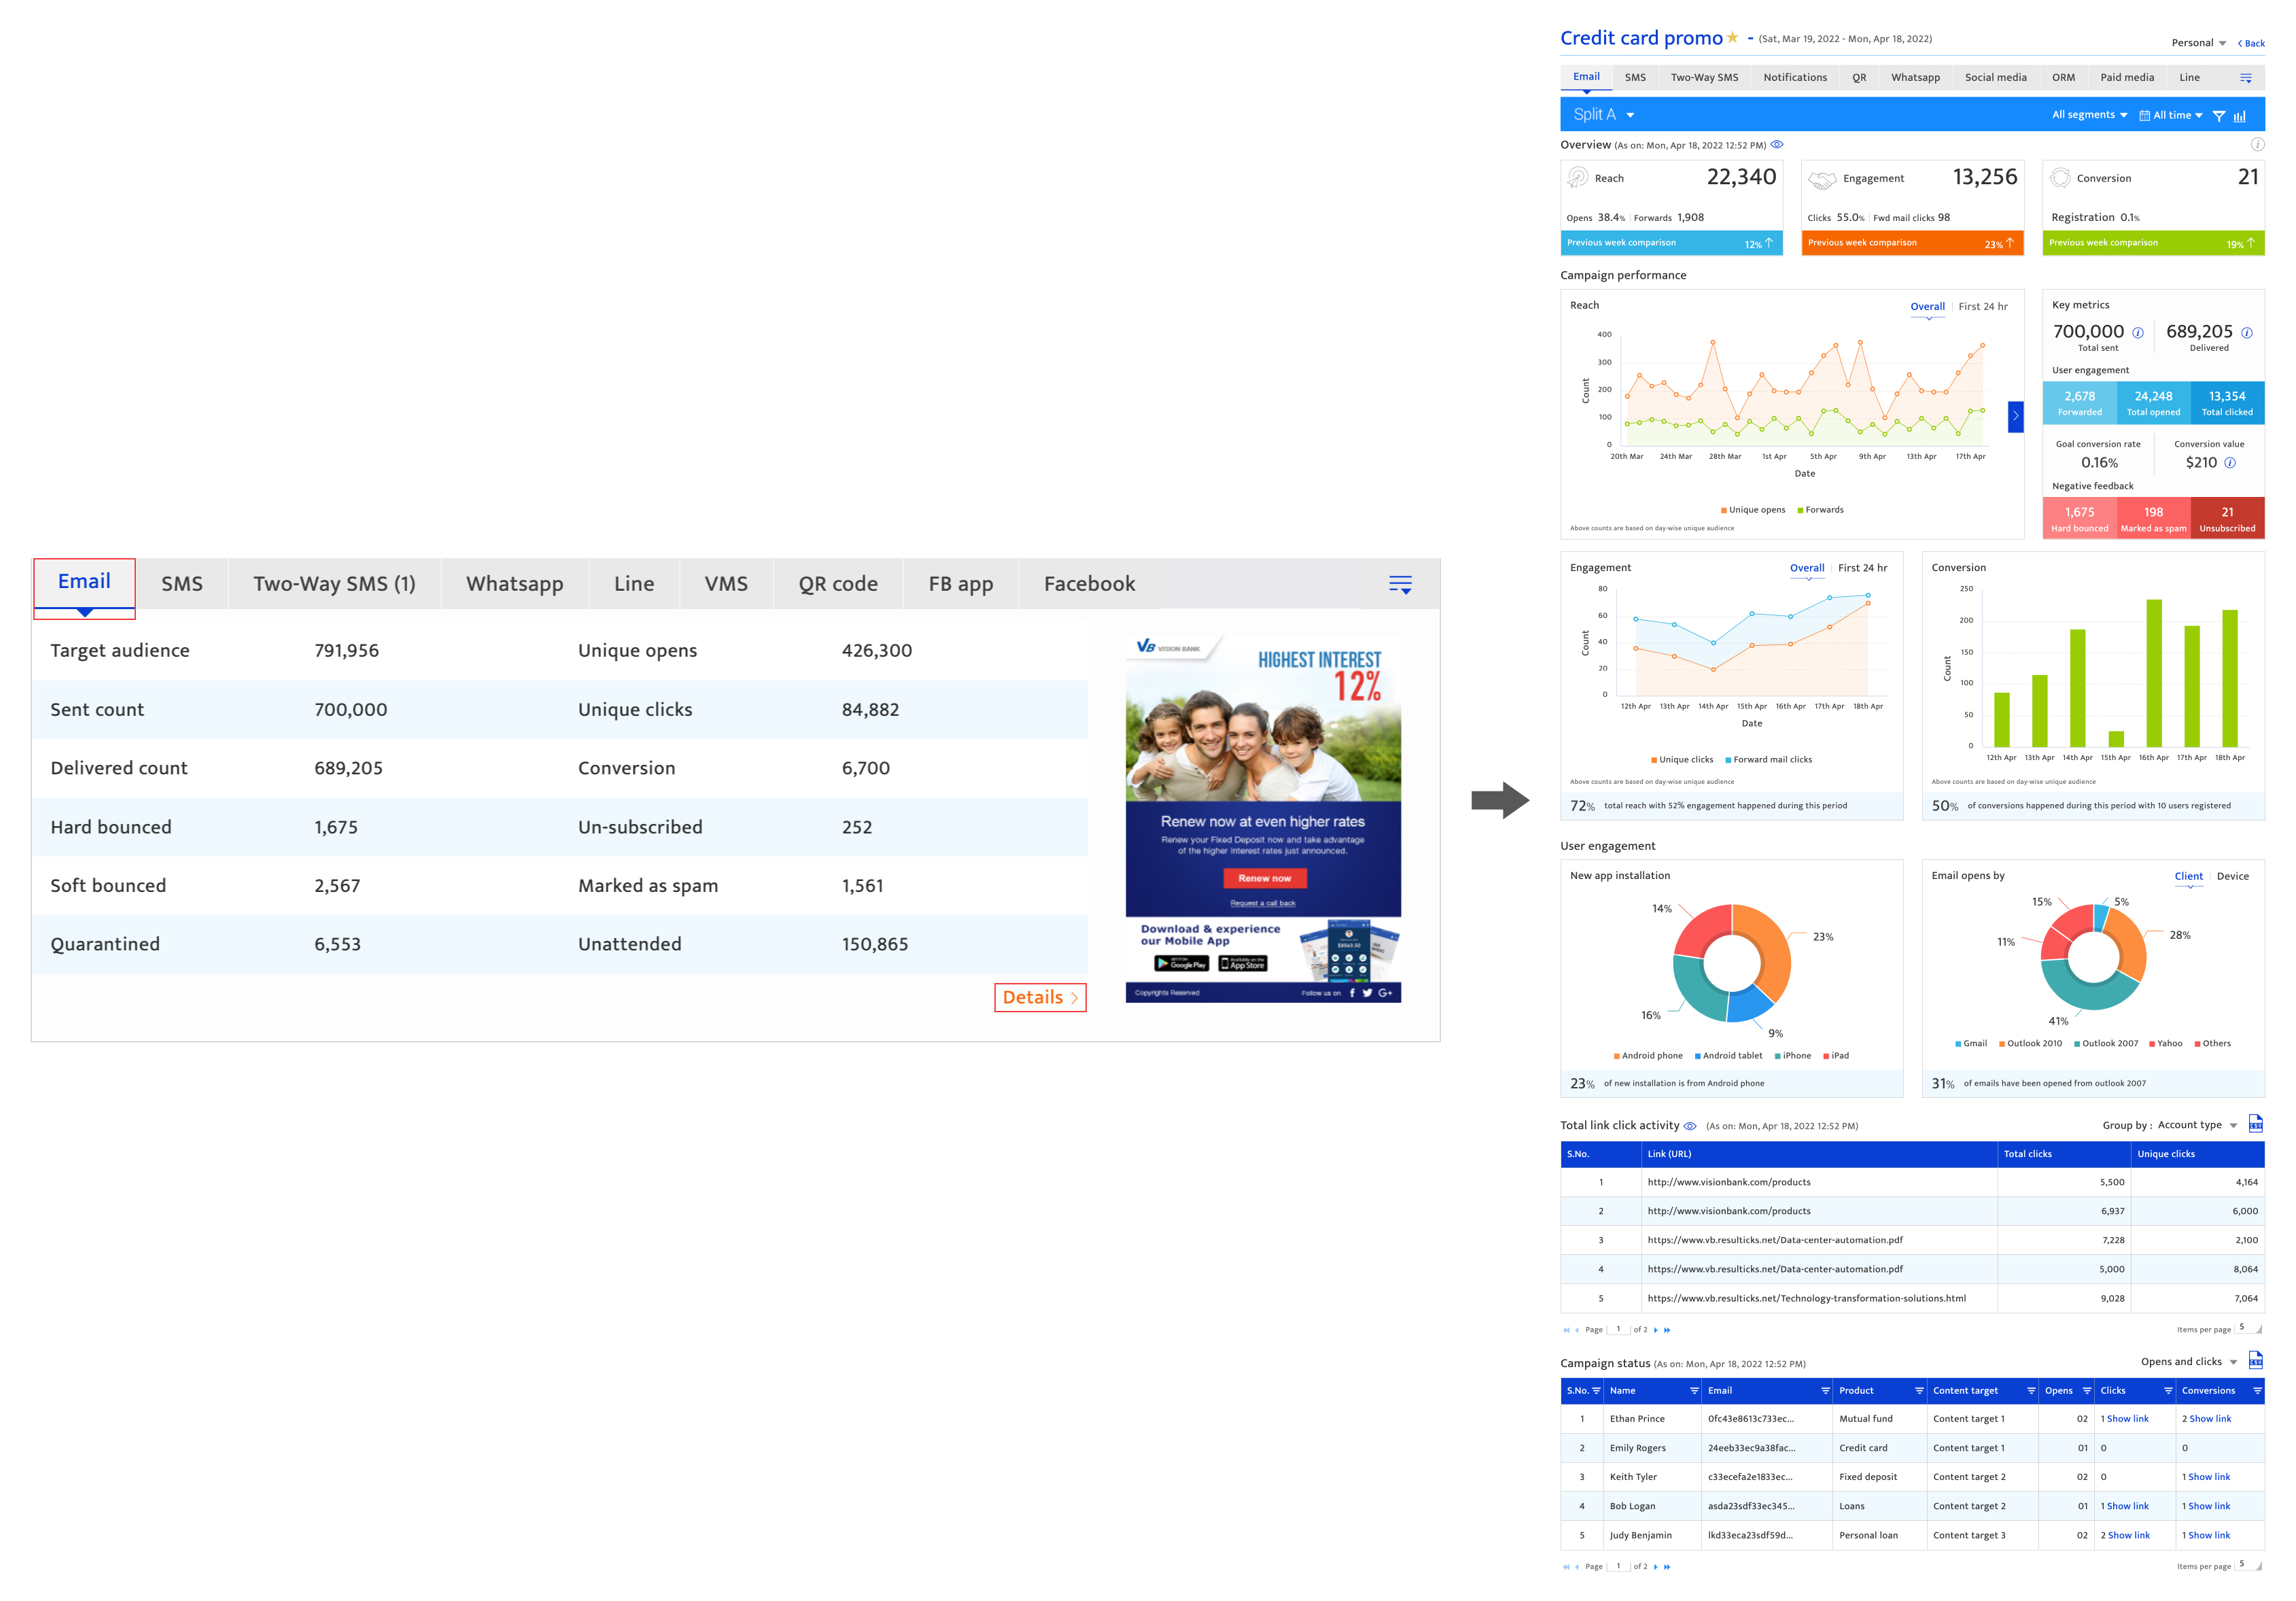
The detailed analytics report is an in-depth, real-time, channel-wise report on campaign performance. It includes key performance metrics relevant to the various campaign channels for the duration of the campaign starting from the first 24 hours. The user has the option to filter the report results in a variety of ways.
Authorization and making changes#
Any user with campaign access can open the detailed analytics report.
Accessing detailed analytics report#
- Select the Analytics module
- Select Campaign analytics from the drop-down list.
- Select a campaign from the campaign list
- Click on the Analytics icon
- Click on the Channel tabs, under the campaign analysis section of the report displayed
Exploring the detailed analytics report#
The detailed analytics report consists of sections that are mostly consistent across all the campaign channels, with the exception of Sentiment Analytics It consists of :
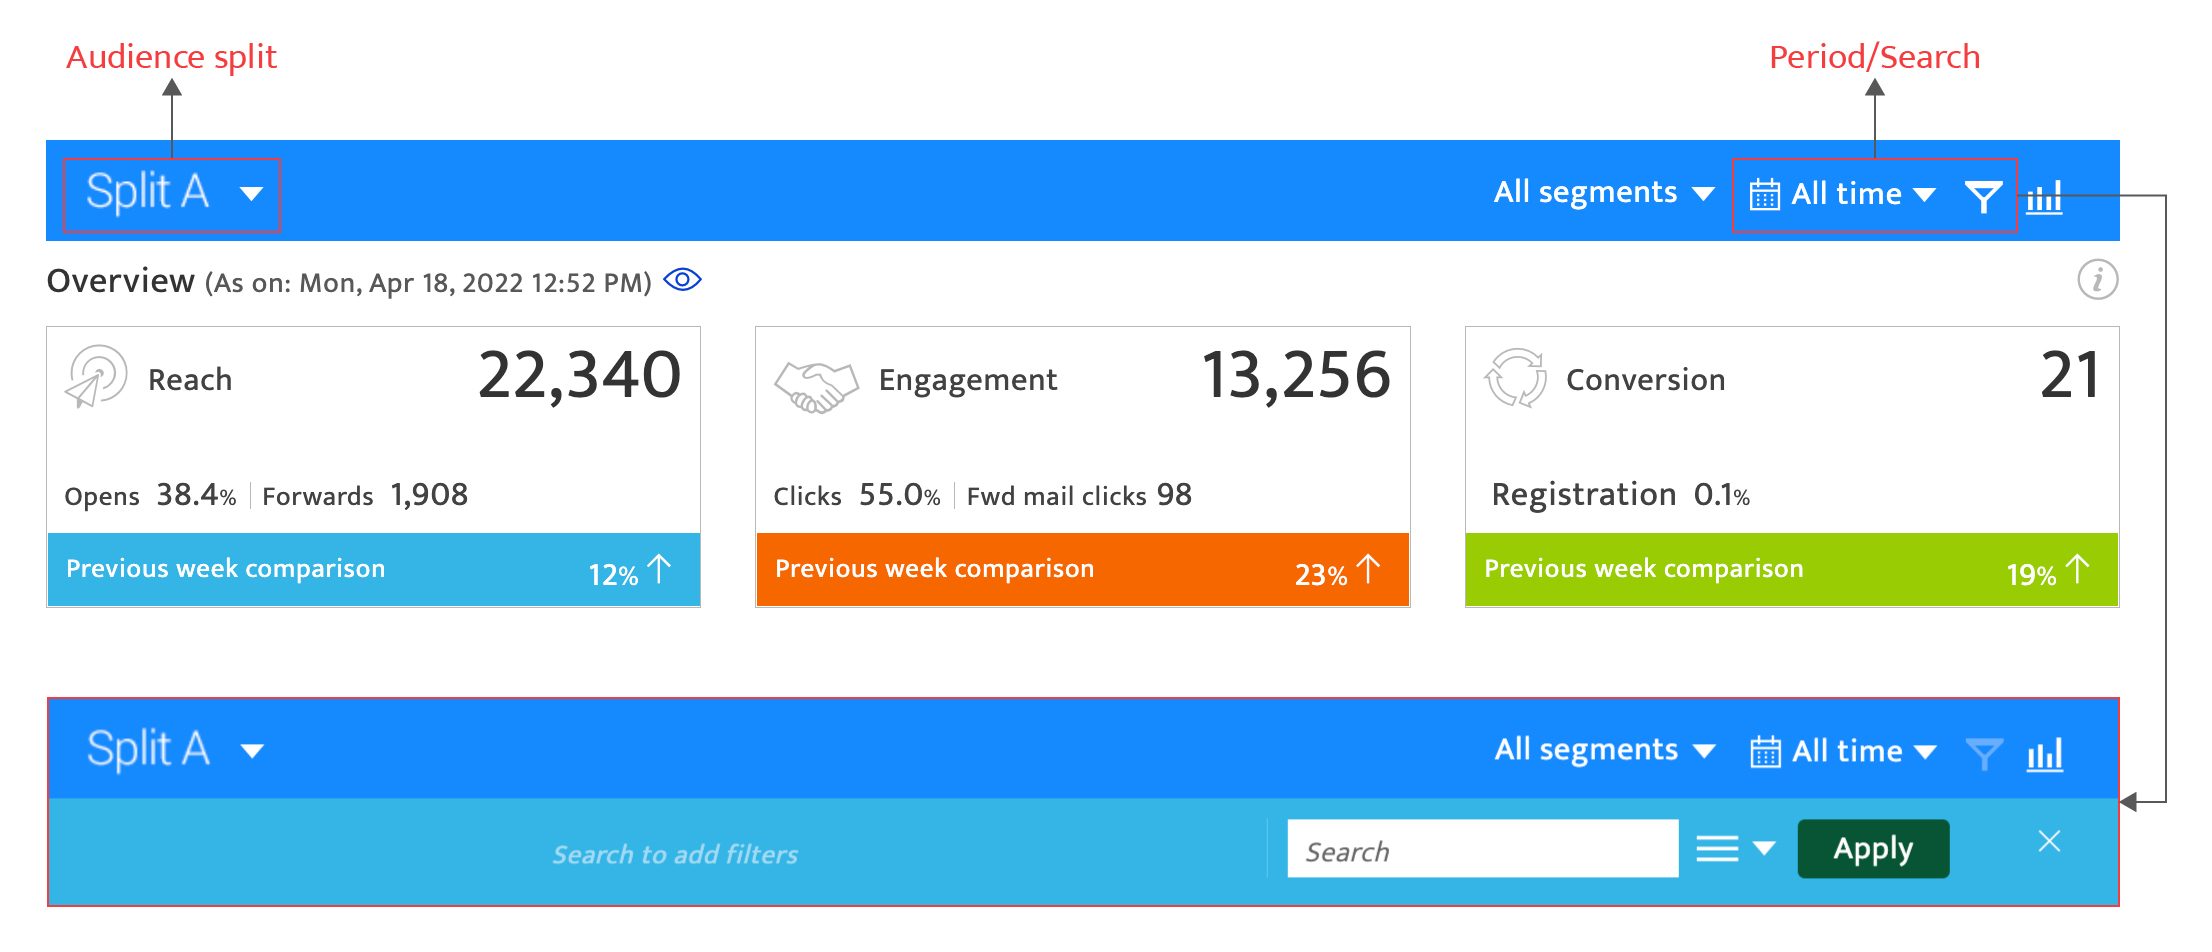
Common Filters :
- Audience split, that can be selected from the drop-down list at the top left corner, if set during campaign creation. This will display the campaign report for the corresponding groups.
- Period, that uses the calendar to determine the reporting period. The period must lie within the campaign duration.
- Advanced searches that can be set by clicking the filter icon to open advanced searches, selecting a filter type and entering a value based on the type selected. Click the **Apply** button to filter the report display. Multiple filters of different types can be added.
- The user can also download a PDF file of the detailed analytics report by clicking on the download icon (next to Advance search)
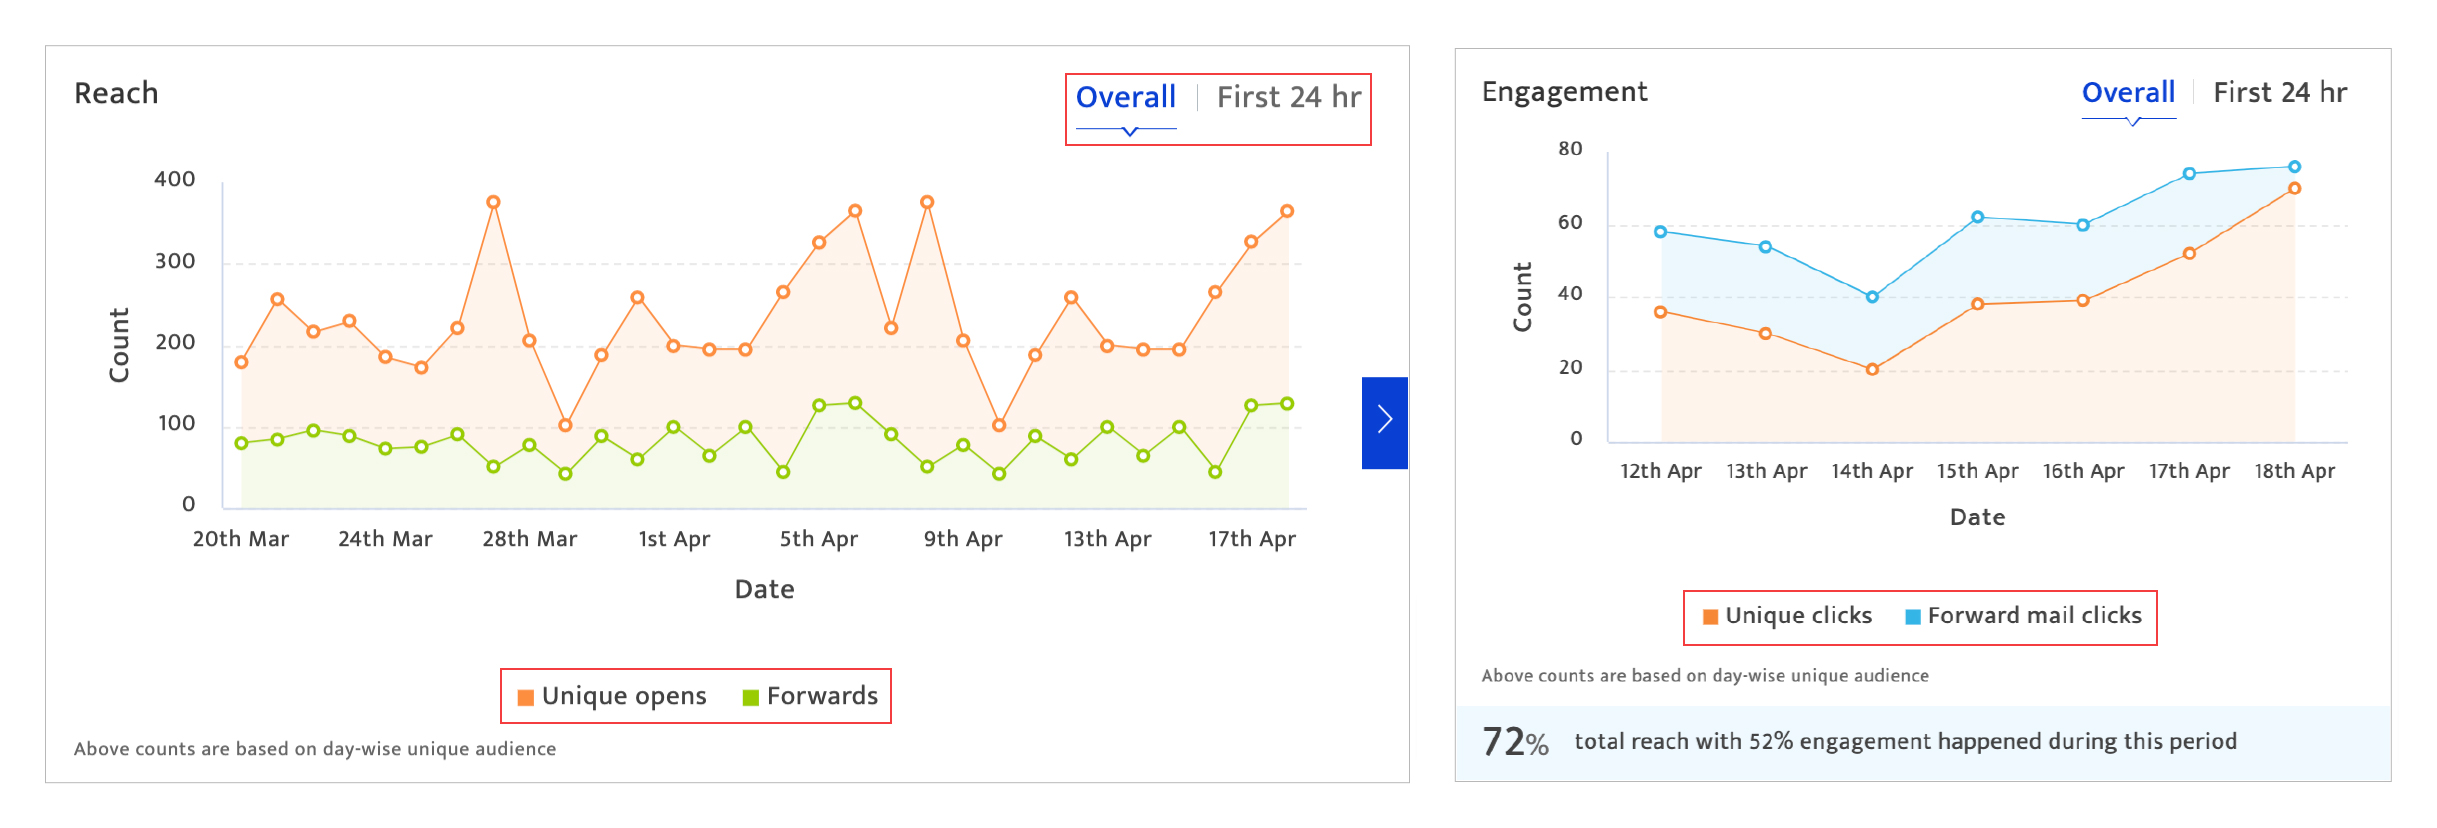
Campaign performance :
- Reach/Engagement
The line graph documents the campaign’s reach/engagement – represented here by unique opens and forwards for the former, and unique clicks and forward mail clicks for the latter – of the campaign over its entire duration, or the first 24 hours.
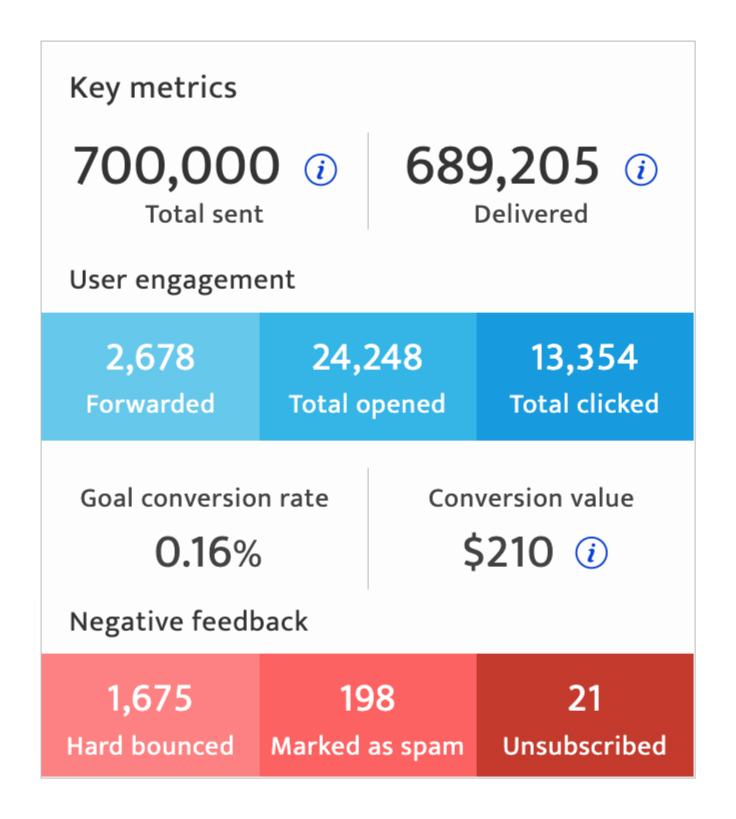
- Key metrics
- Total audience
- Communications delivered
- Total user engagement – forwards, opens and clicks
- Goal conversation rate
- Negative feedback – bounces, spams, and unsubscriptions
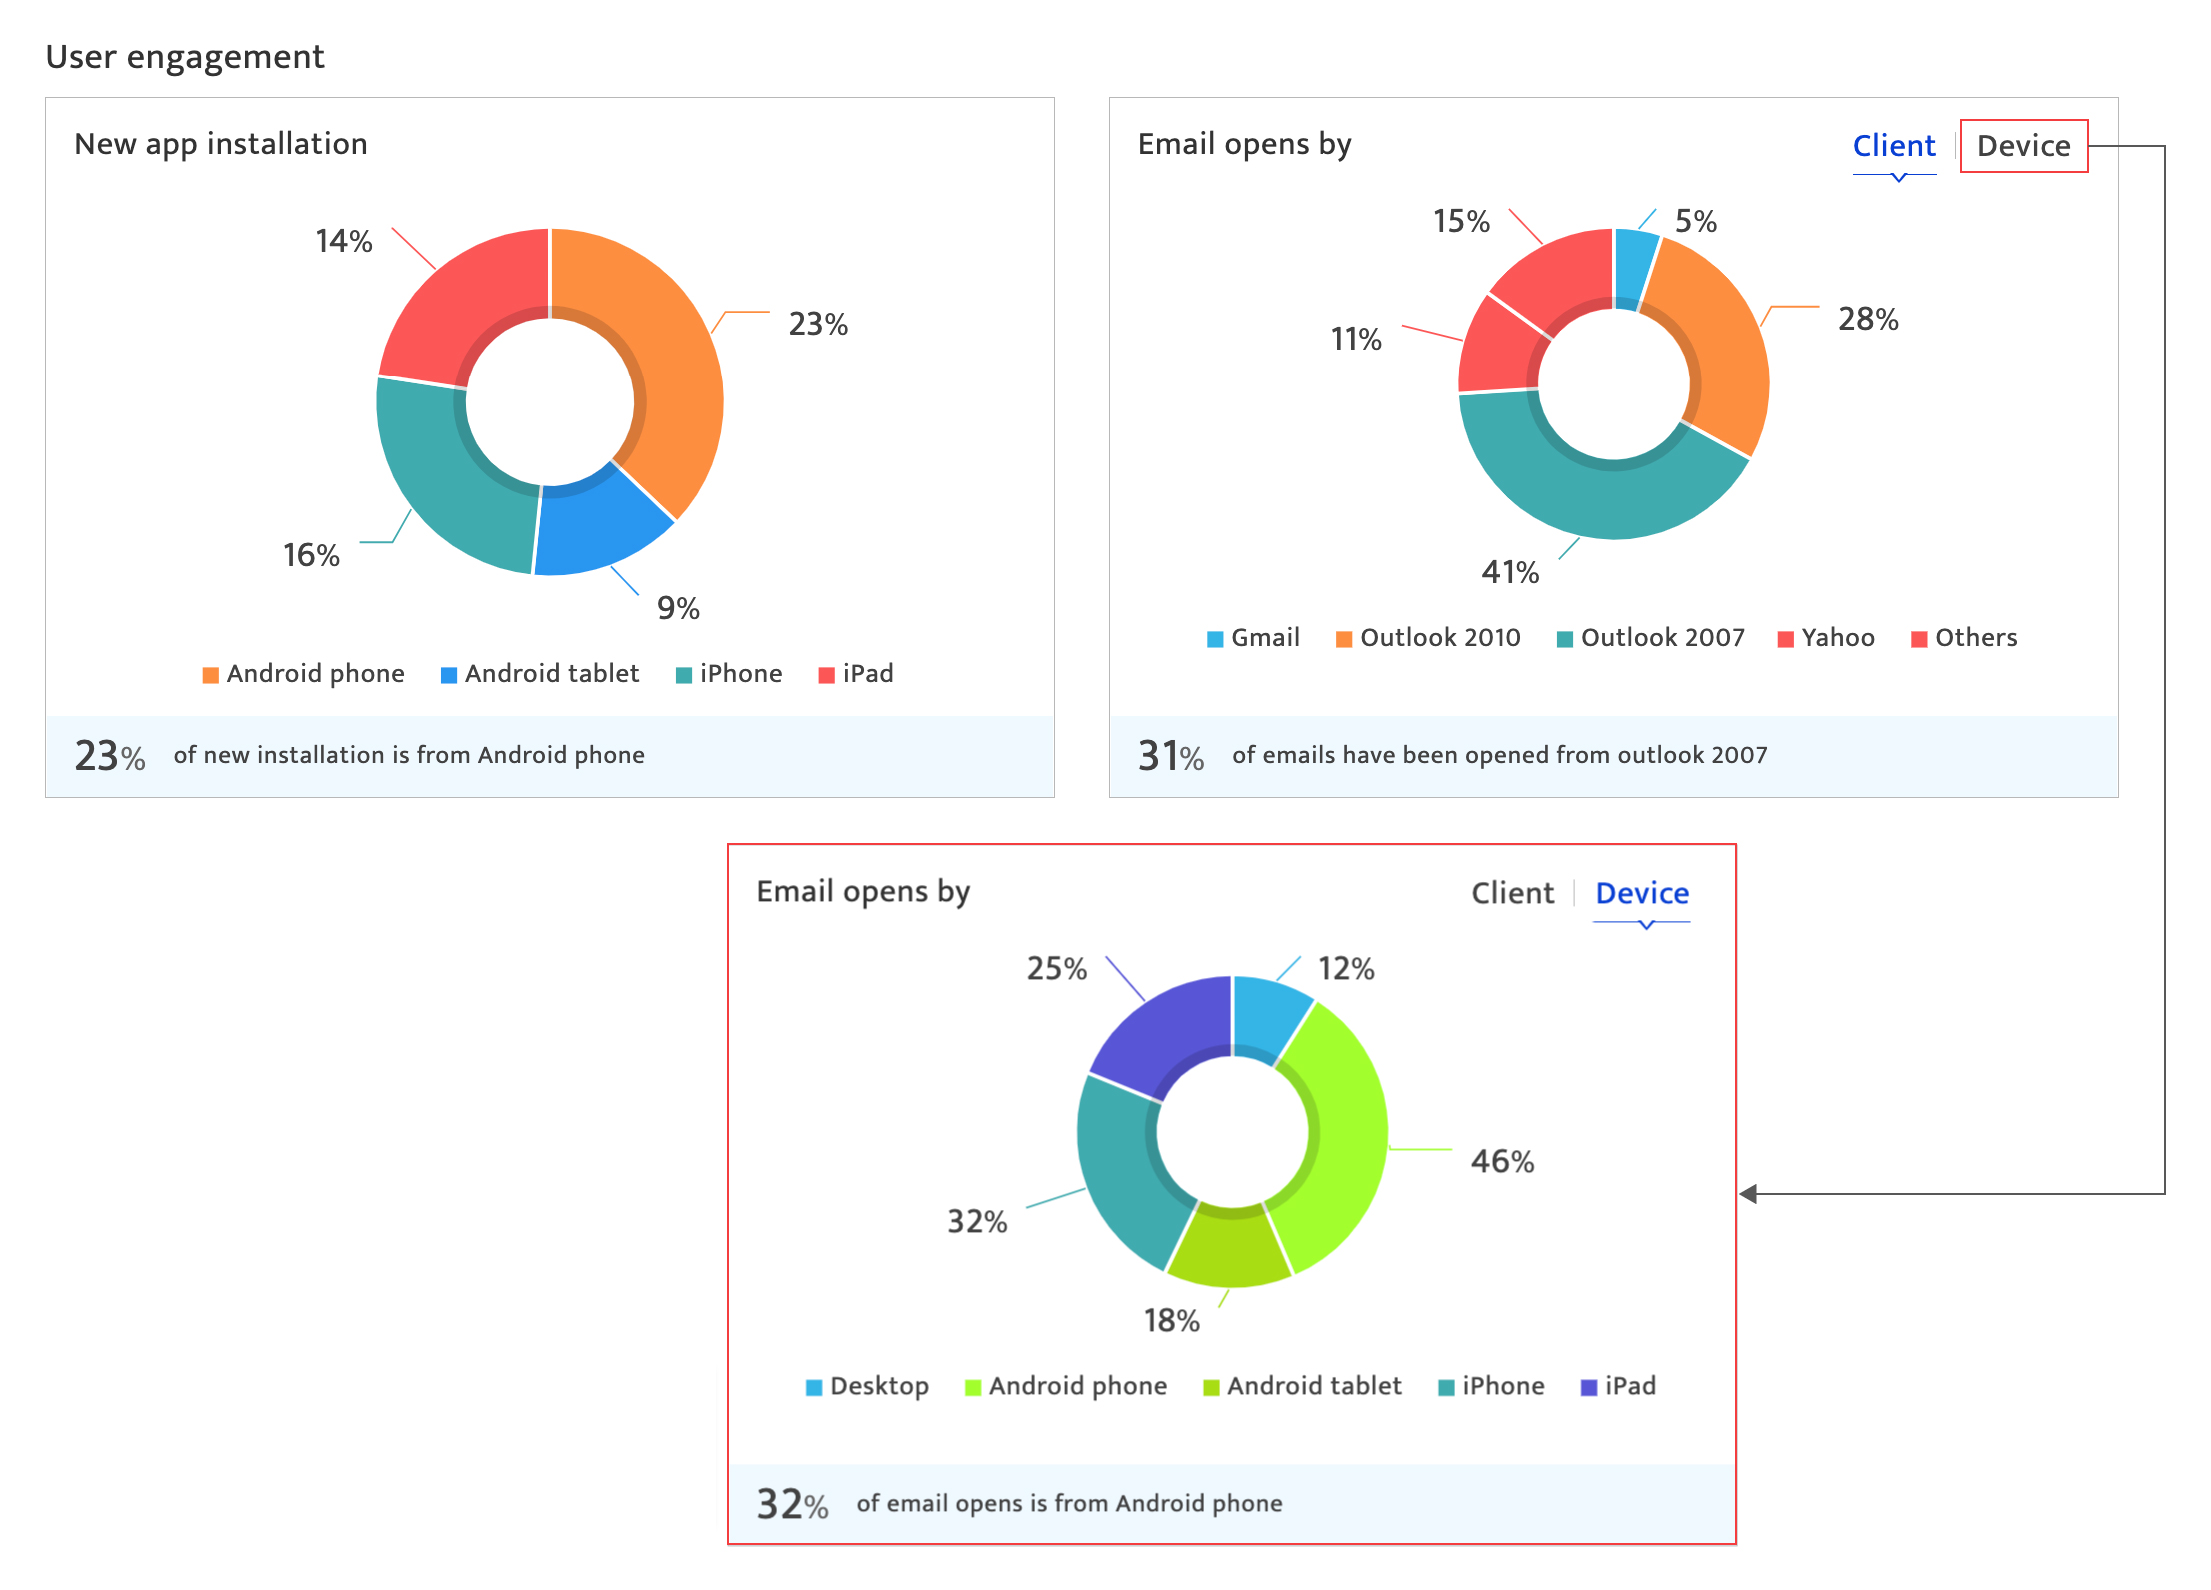
User engagement#
This section documents the audience’s geographic information (i.e. what percentages of user engagement comes from which location) and the browser/device-based open rate breakdown.
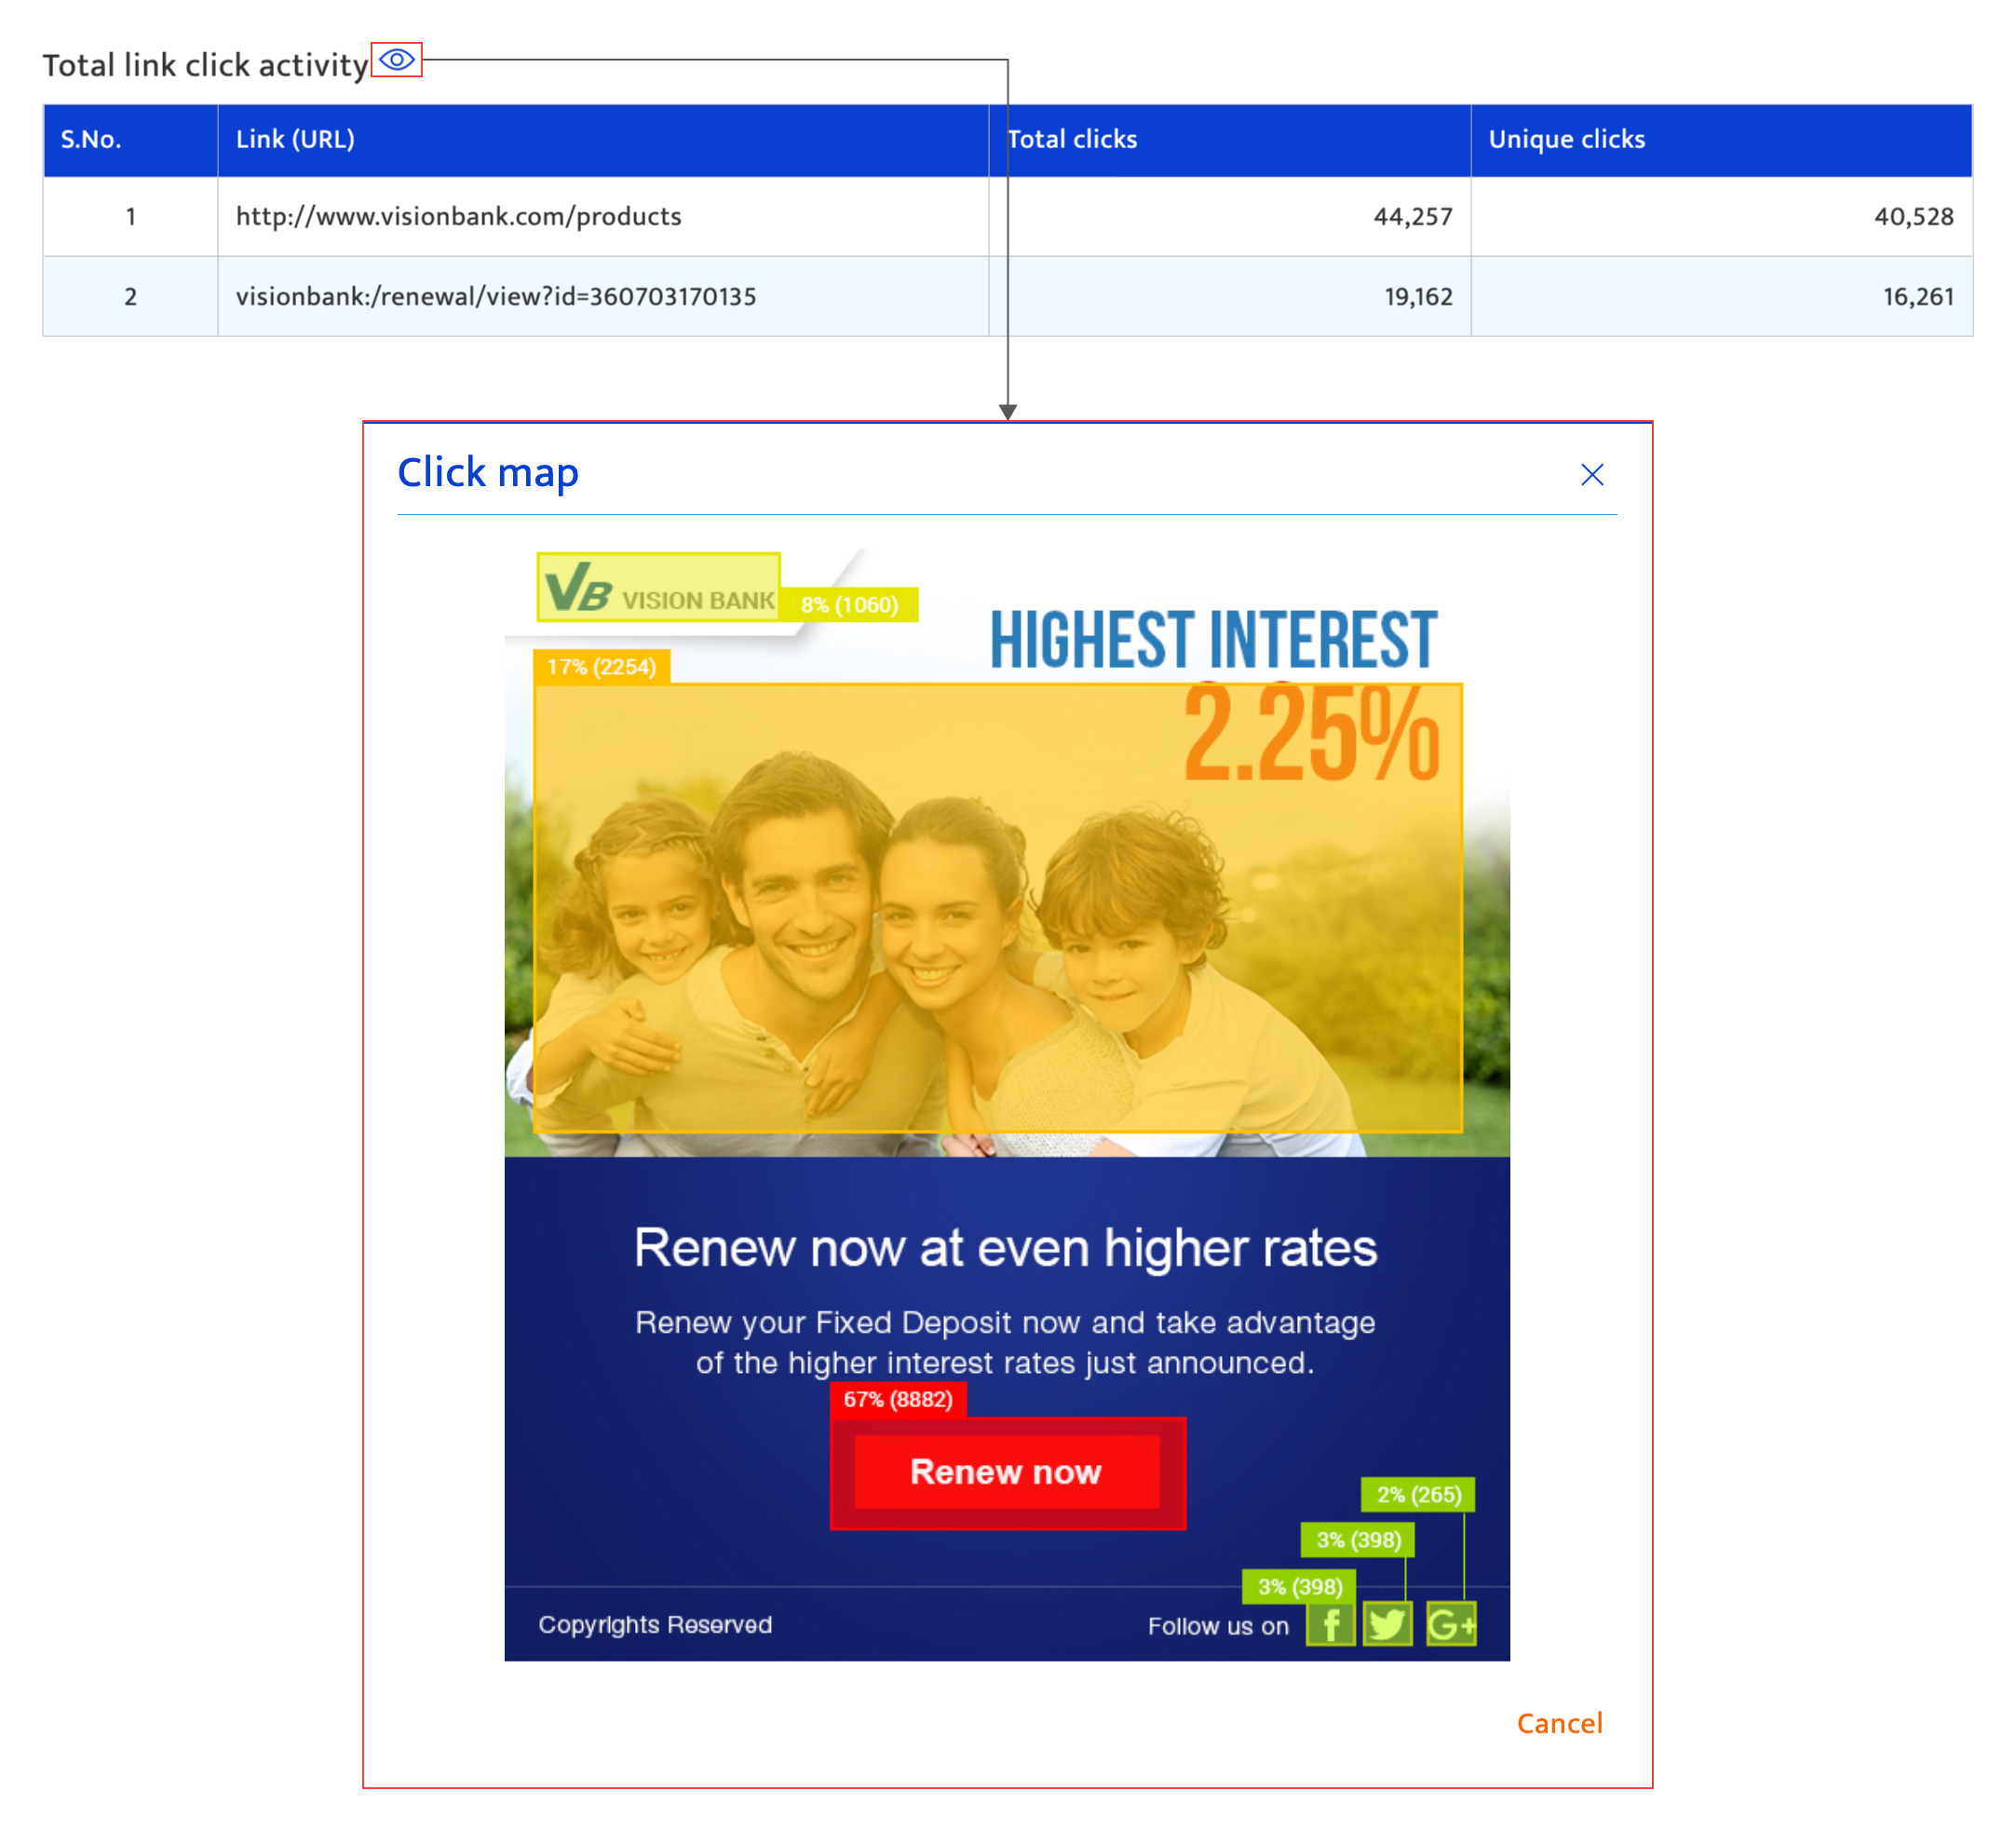
Total link click activity#
This section documents the total and unique clicks for all URLs—both the Smart Link and others—used in the communication.
Click the preview button to see the click distribution across the campaign content
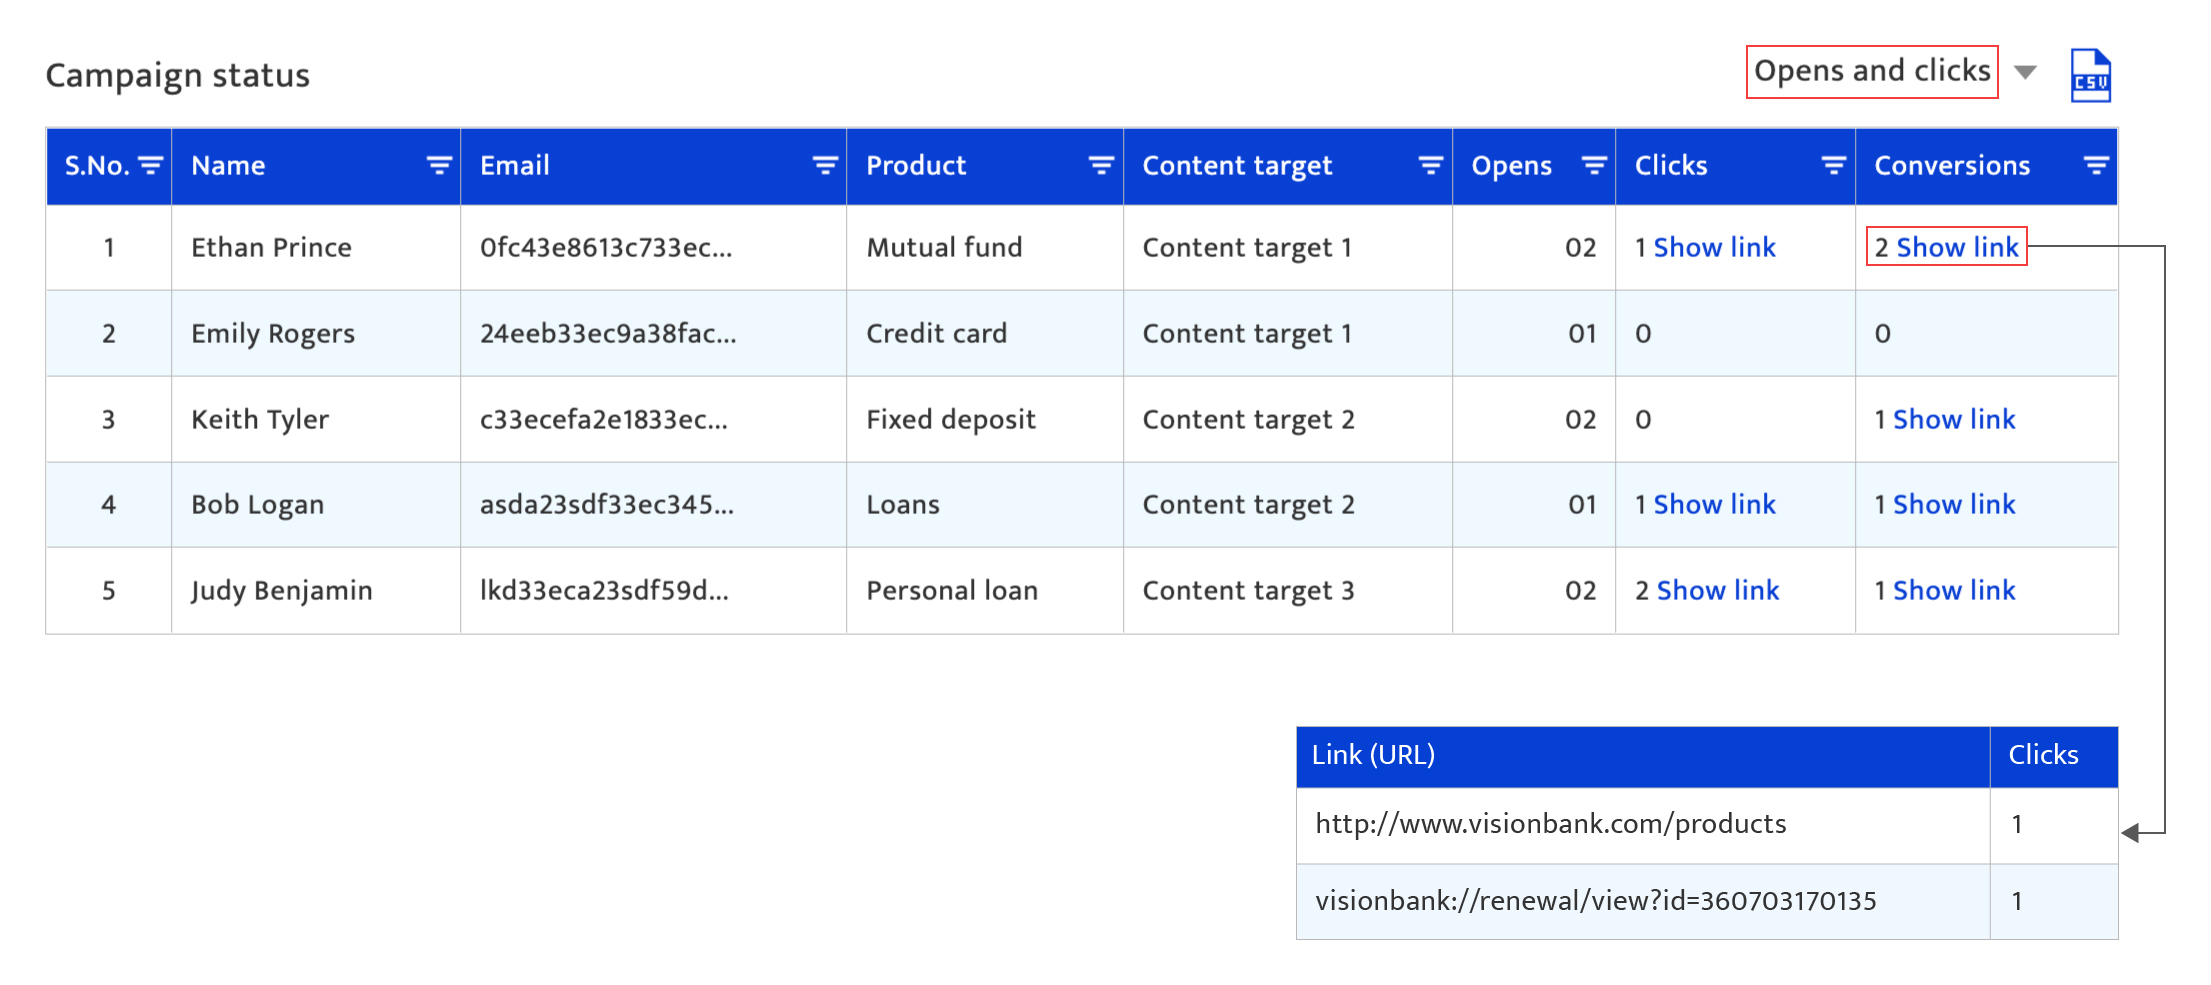
Campaign status#
- Opens and clicks displays who clicked on the communication, their contact handle for the channel, the number of their clicks, opens, and conversion (as defined during the campaign planning stage). Click show link to see the link(s) the audience member clicked.
- Use the drop-down list to also see those who:
- (a) Unsubscribed from the communication
- (b) Did not receive the communication because it bounced/was undelivered
- (c) Marked the communication (in the case of email) in the spam box
- (d) Forwarded the communication to their network