Detailed app analytics report
What is it?#
The detailed analytics report is an in-depth, real-time report documenting audience behaviour on the mobile app as a result of the campaign. It includes key performance metrics relevant to the entire campaign starting from the first 24 hours. The user has the option to filter the report results in a variety of ways. Authorization and Making Changes.
Authorization and making changes#
Any user with campaign access can open the detailed analytics report.
Accessing detailed analytics report#
- Select the analytics module
- Select campaign analytics from the drop-down list.
- Select a campaign from the campaign list
- Click on the Analytics icon
- Click on the Channel tabs, under the campaign analysis section of the report displayed and click on the Details tab.
- Click on the web/app tab
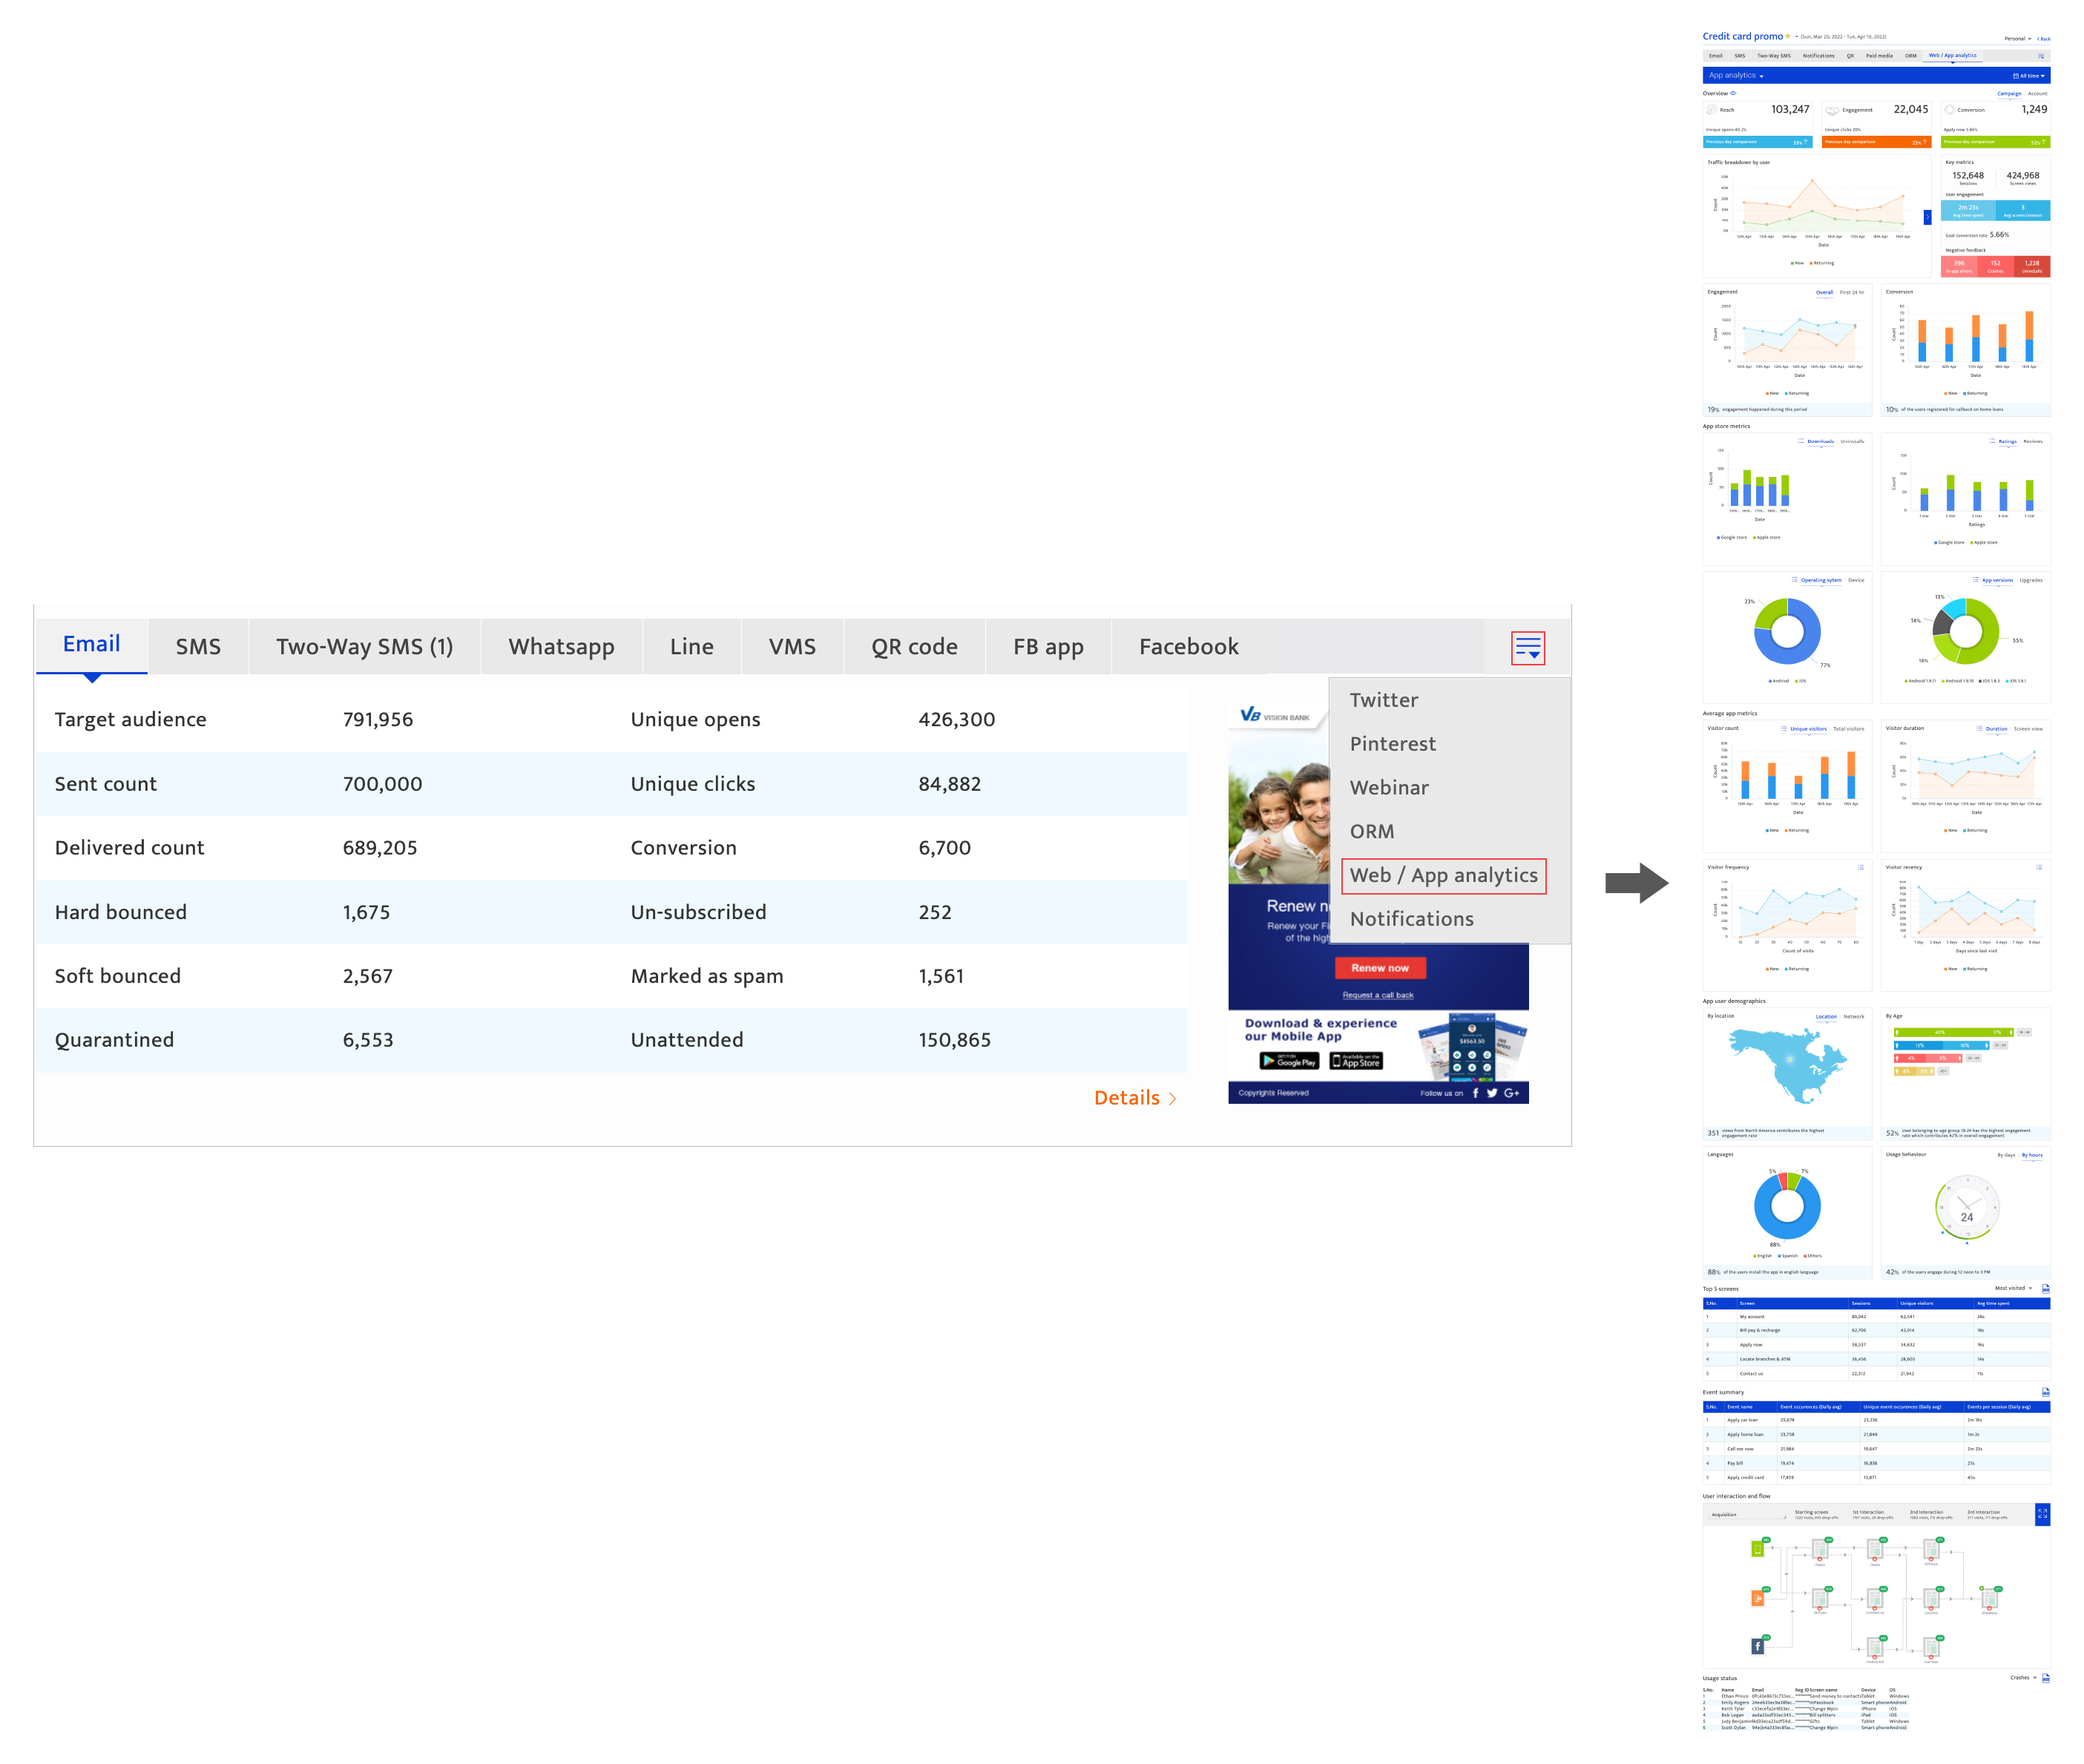
Exploring the app detailed analytics report#
Common filters :
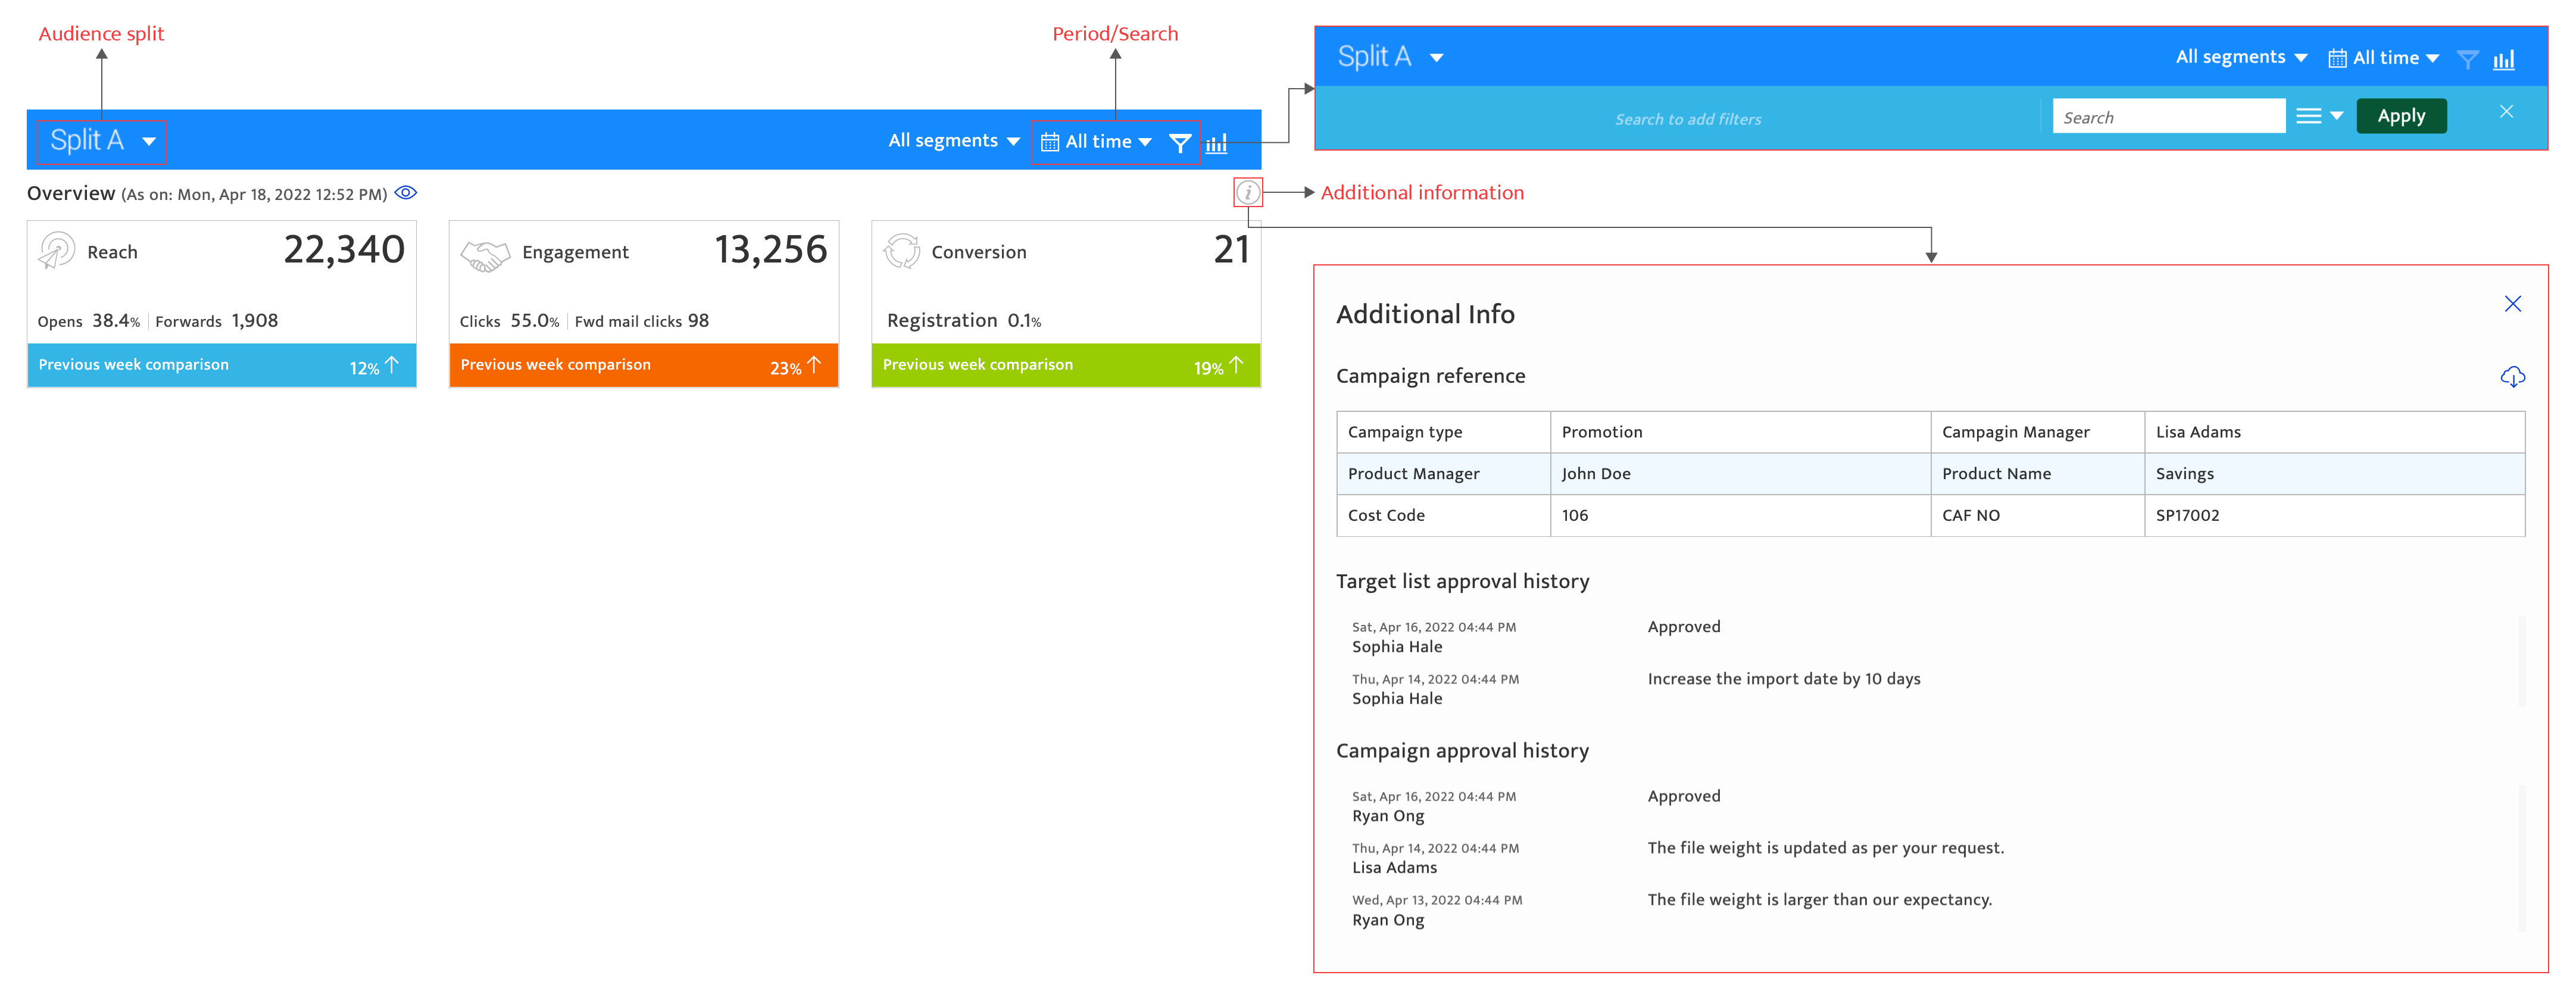
- Analytics platform, that can be selected from the drop-down list at the top left corner, if set during campaign creation. This will display the campaign report for the corresponding analytics platform.
- Period, that uses the calendar to determine the report period. The period must lie within the campaign duration.
- Advanced searches that can be set by clicking the filter icon to open advanced searches, selecting a filter type and entering a value based on type selected. Click the Apply button to filter the report display. Multiple filters of different types can be added.
- User can also download a PDF file of the detailed analytics report by clicking on download icon (next to Advance search)
- Click the information icon to access additional campaign information that consists of the campaign reference and the approval histories of both the campaign and the target list used.
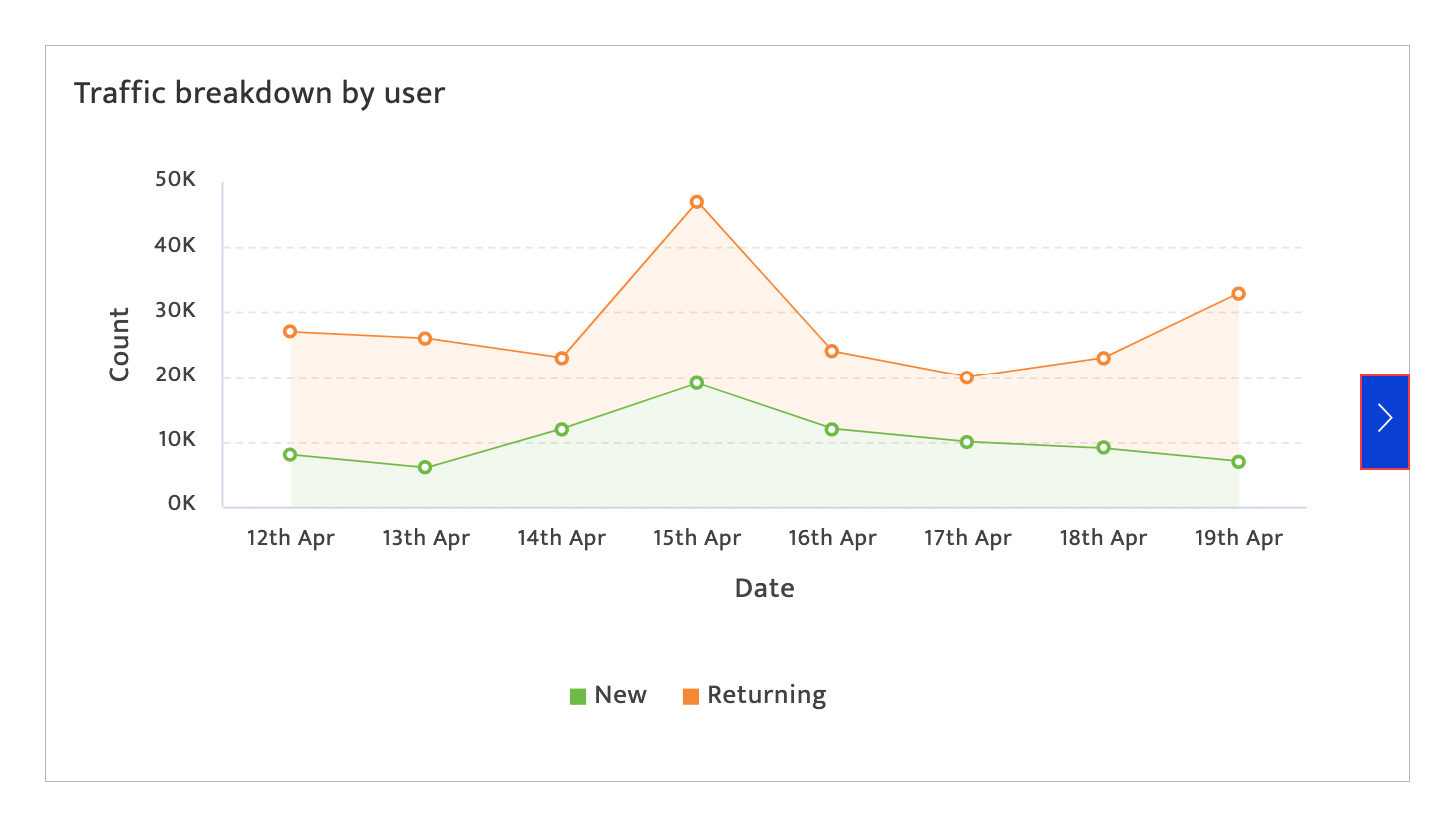
Traffic breakdown#
- Traffic breakdown by user
The line graphs documents breakdown of traffic to the mobile application by users as a result of the campaign over a specified duration. The user can expand the report to view a larger duration by clicking on ‘>’ icon. The user can hover over the graph to view the specific data for that day.
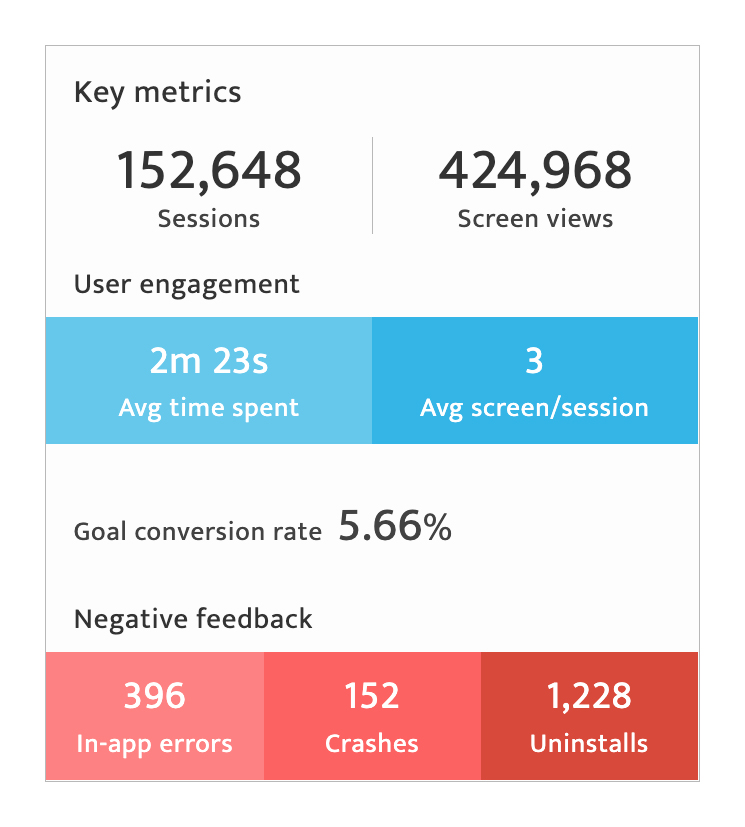
- Key metrics
The key metrics displayed here include:
- Sessions
- Screen views
- Total user engagement – average time spent/session, Average screens/session
- Goal conversation rate
- Negative feedback – In-app errors, crashes, uninstalls
Campaign performance#
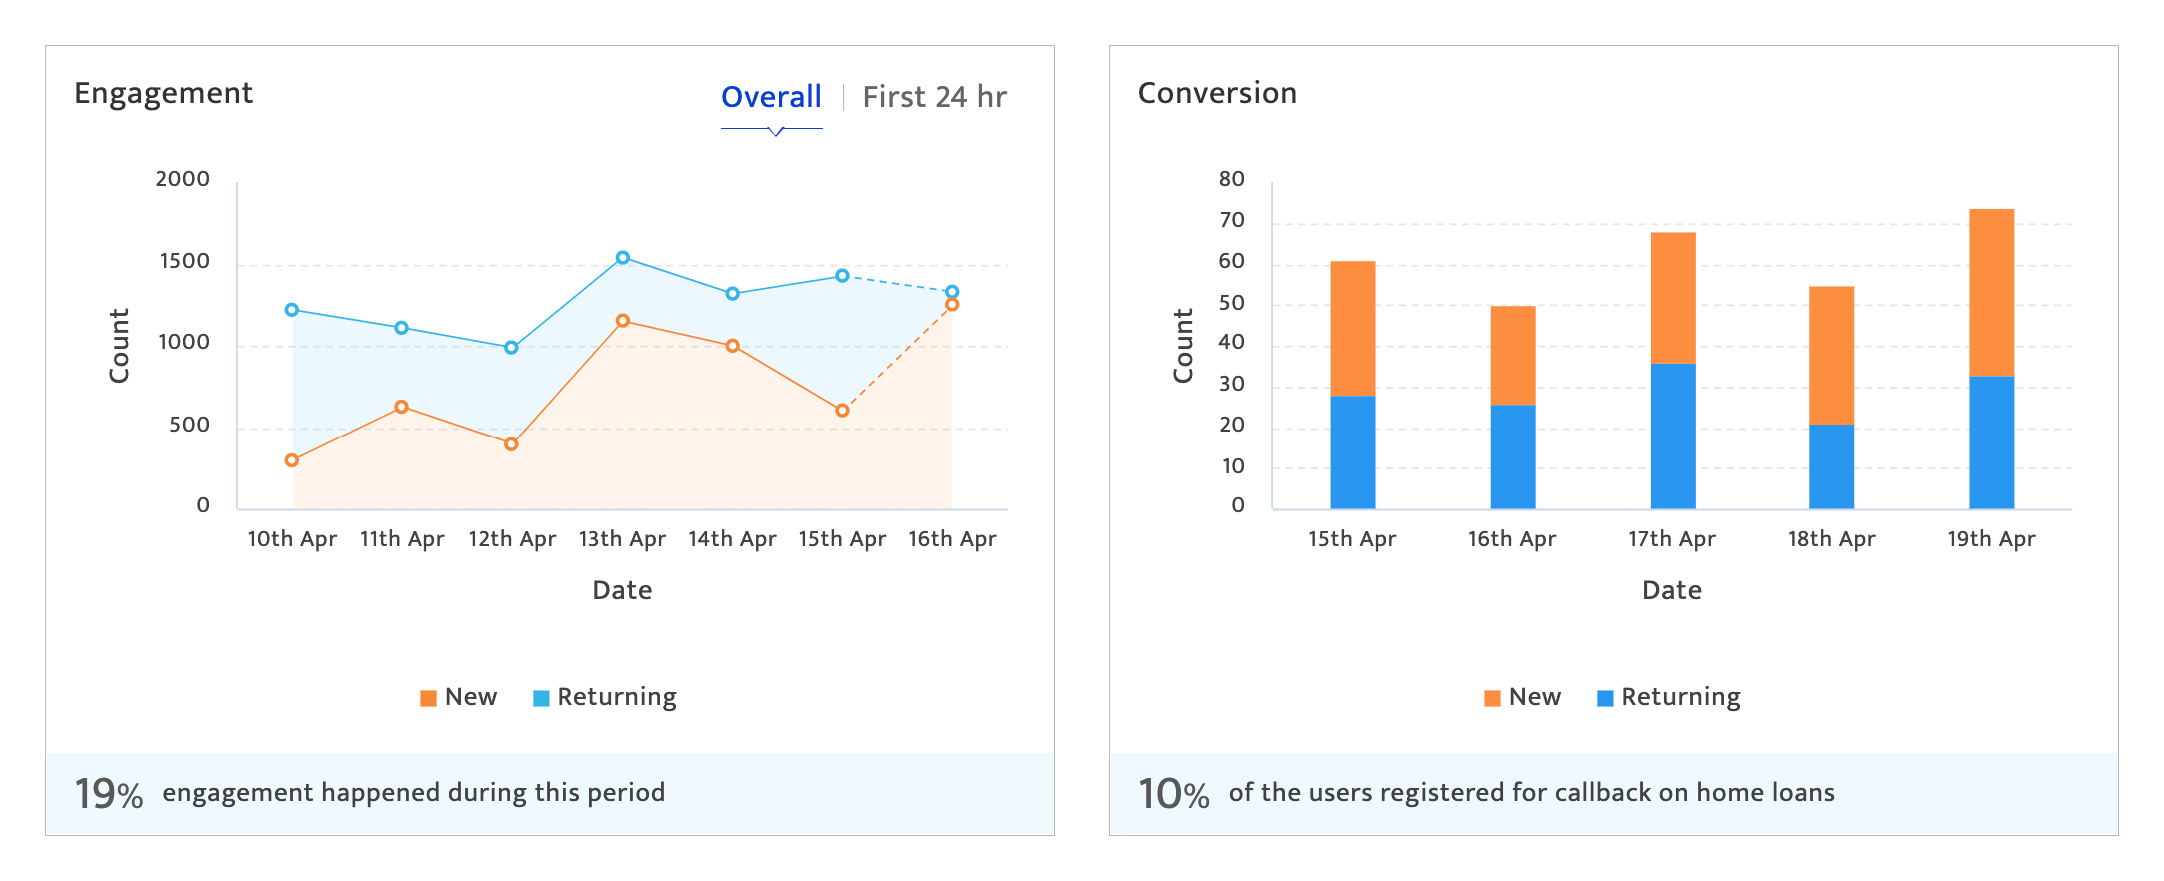
- Engagement
This stacked line chart documents the campaign’s daily engagement broken down by the type of user (new/returning) that were engaged over a specified time period or the first 24 hours.
- Conversion
These stacked bar graph documents the campaign’s daily conversions broken down by the type of user(new/returning) that converted over the specified time period
App store metrics#
This section documents app store metrics around app store behavior and user device details.
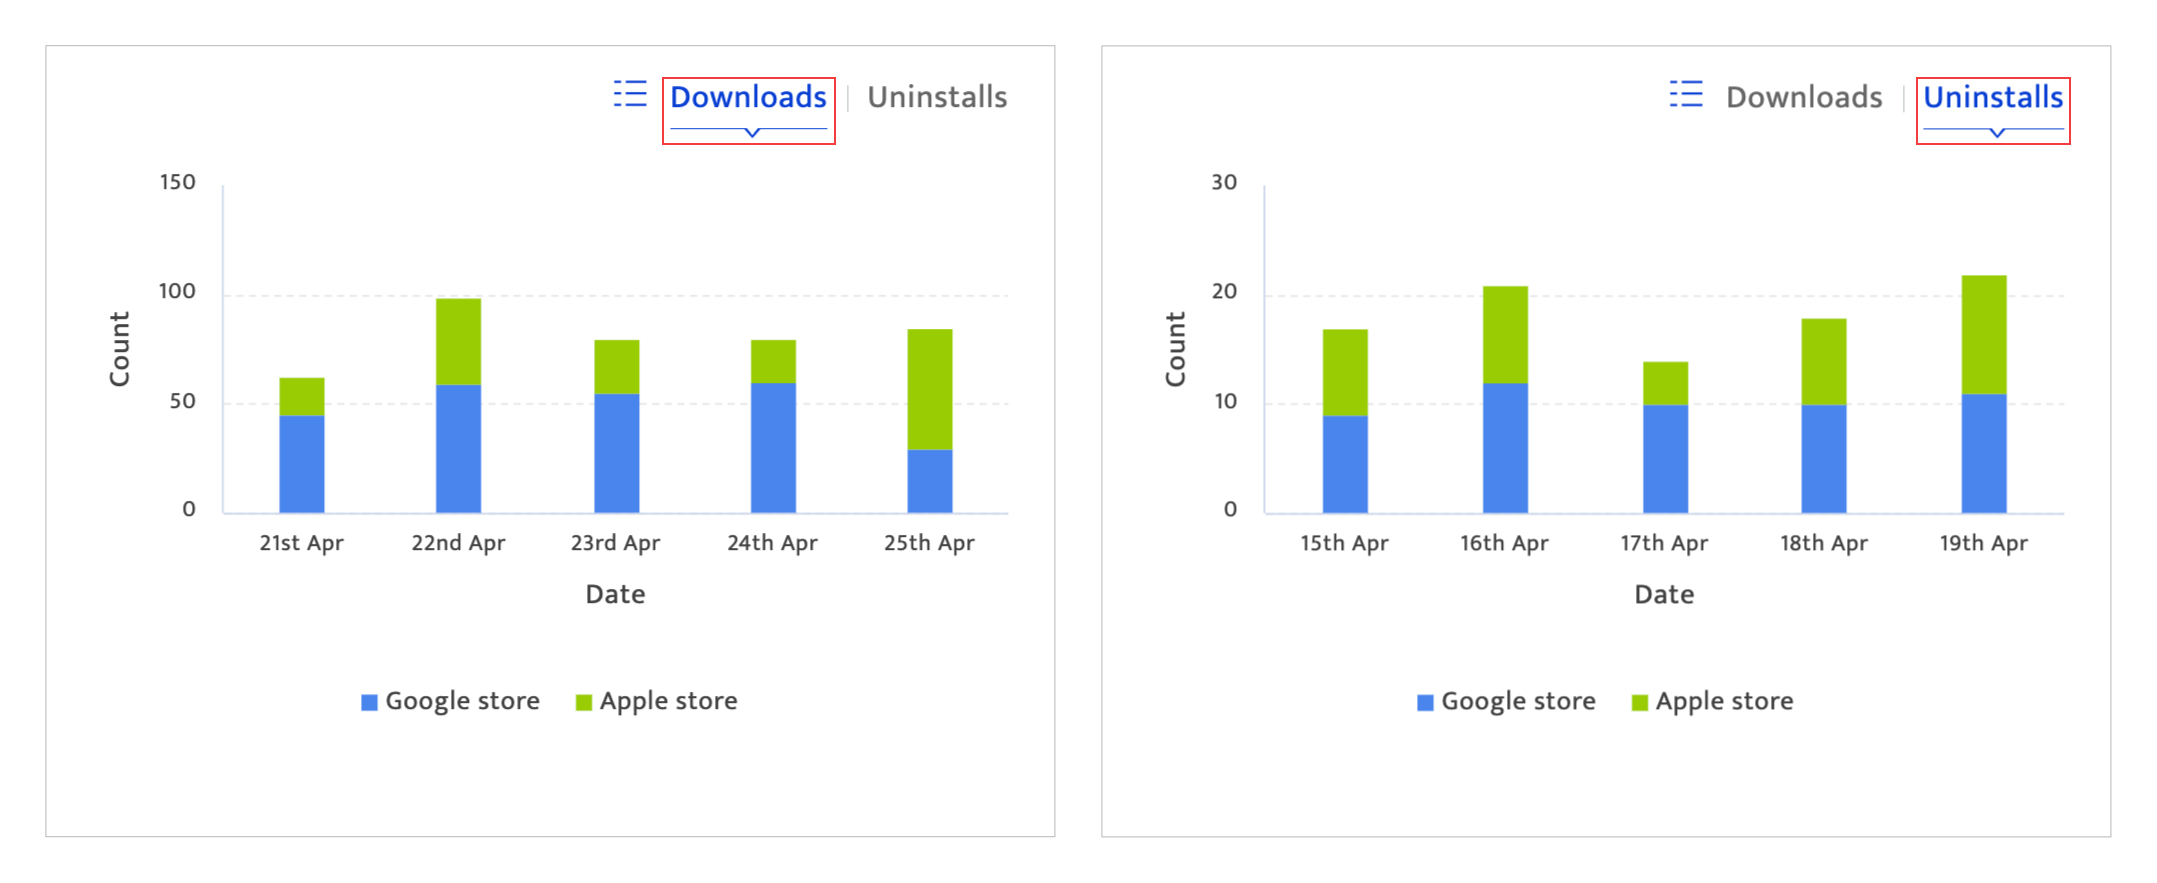
- Downloads/Uninstalls
These stacked bar graph documents the daily number of users that downloaded the mobile app broken down by the type of app store (Apple Store, Google store) over a specified time period. Similar information can be accessed to get data on number of app uninstalls by switching to the appropriate tab.
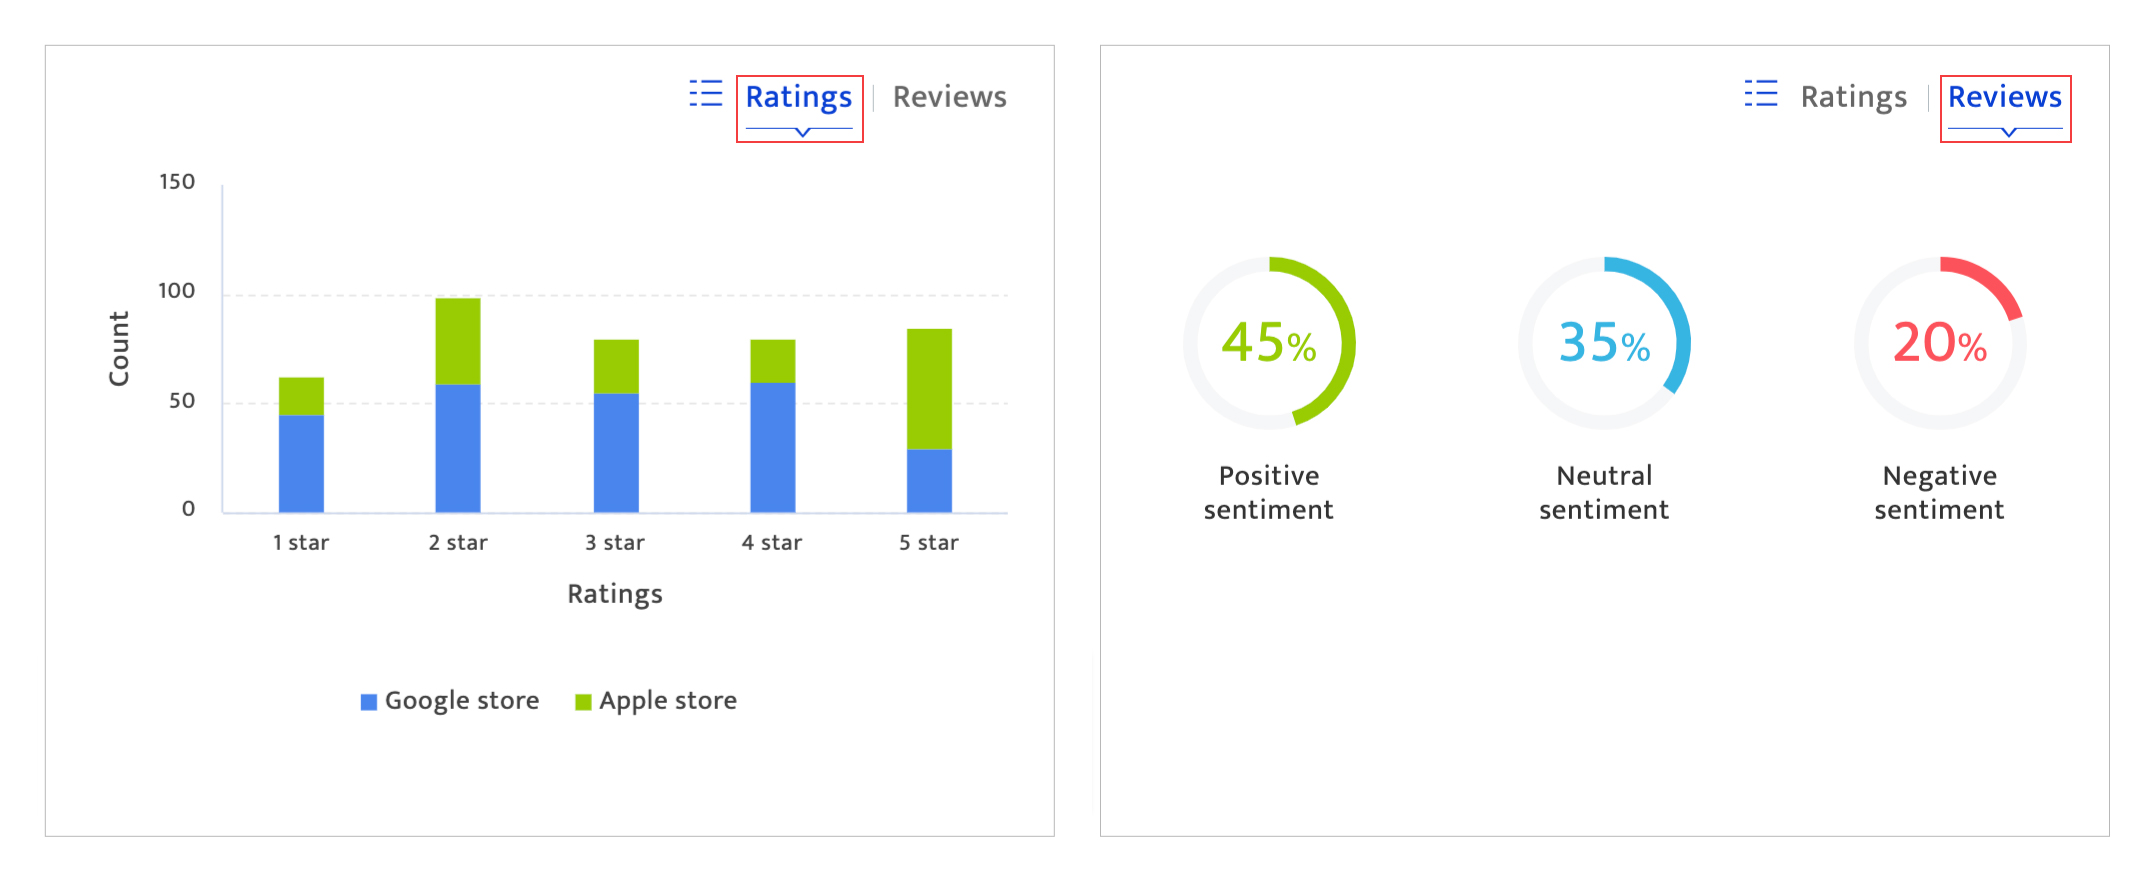
- Ratings/Reviews
The stacked bar graph represents the number of users who have given the app ratings during the campaign duration broken down by rating level. Each rating level is further broken down across the app store the rating was given on. Click the reviews tab to see a % breakdown of the sentiments (positive, negative, neutral) associated with all reviews given during the campaign duration.
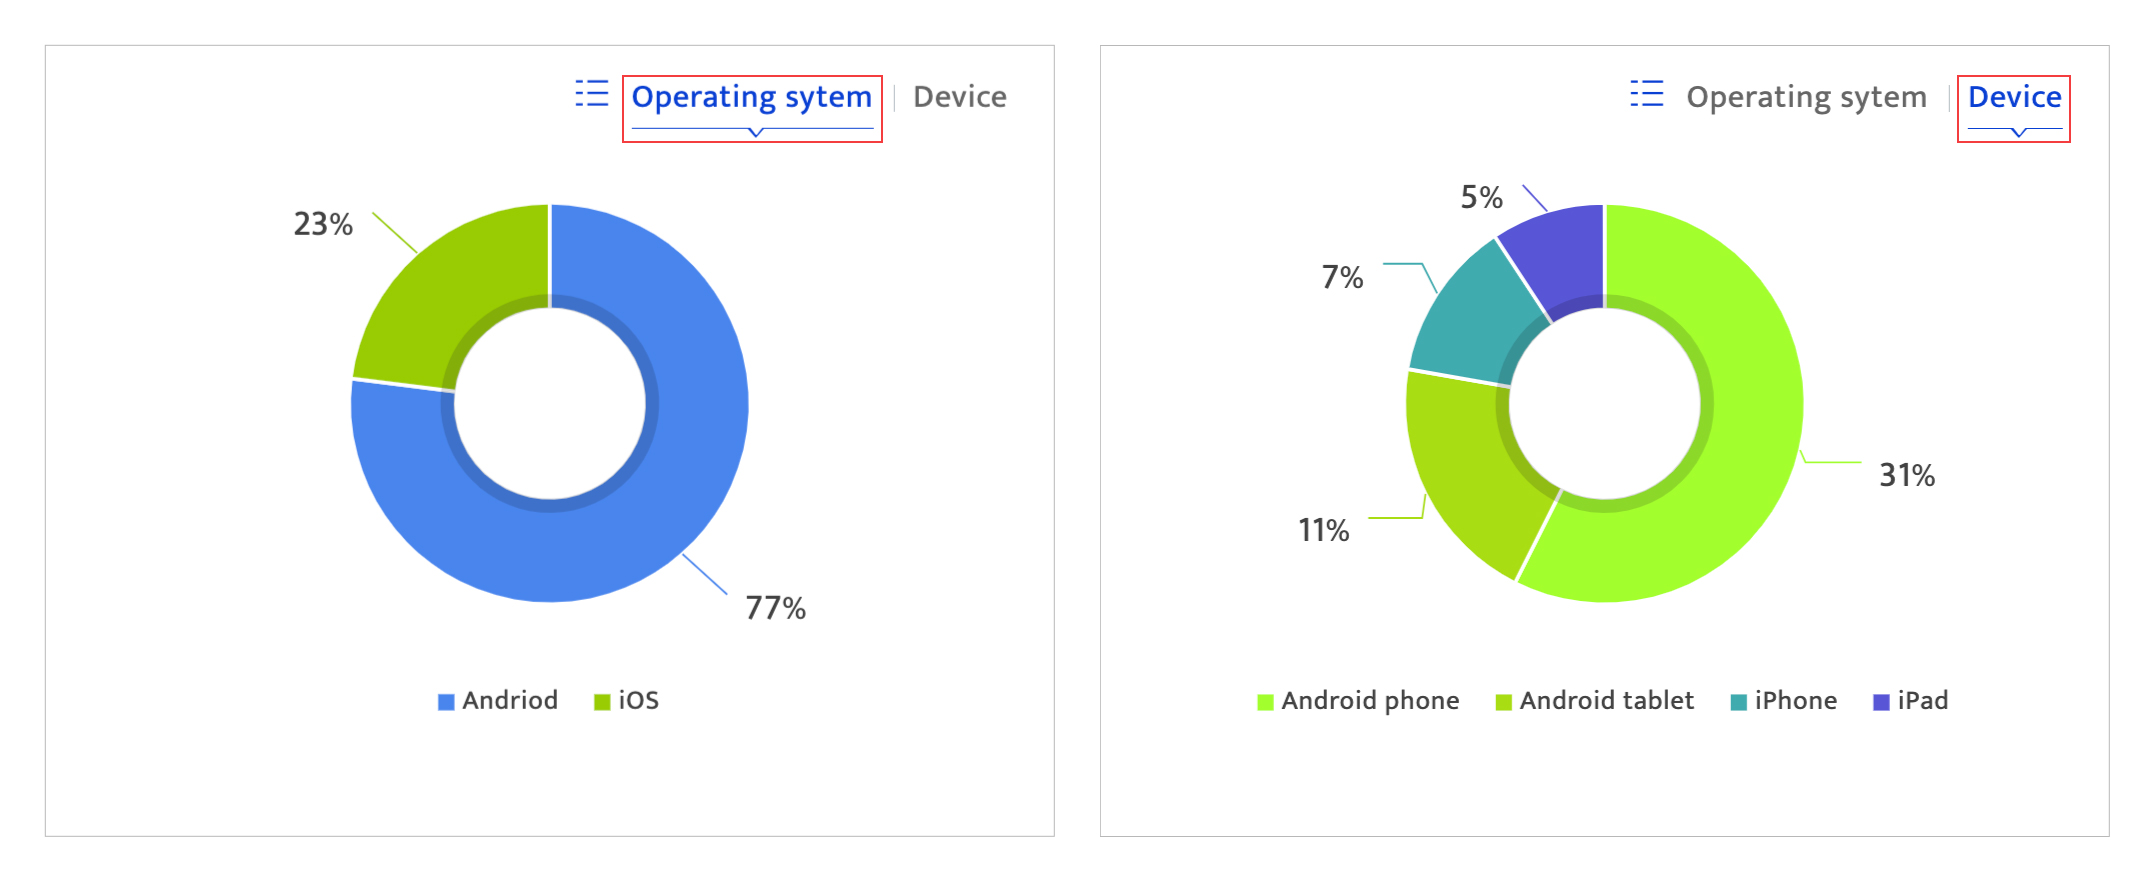
- Operating system/device
- By operating systems
- By device types across phone and tablets.
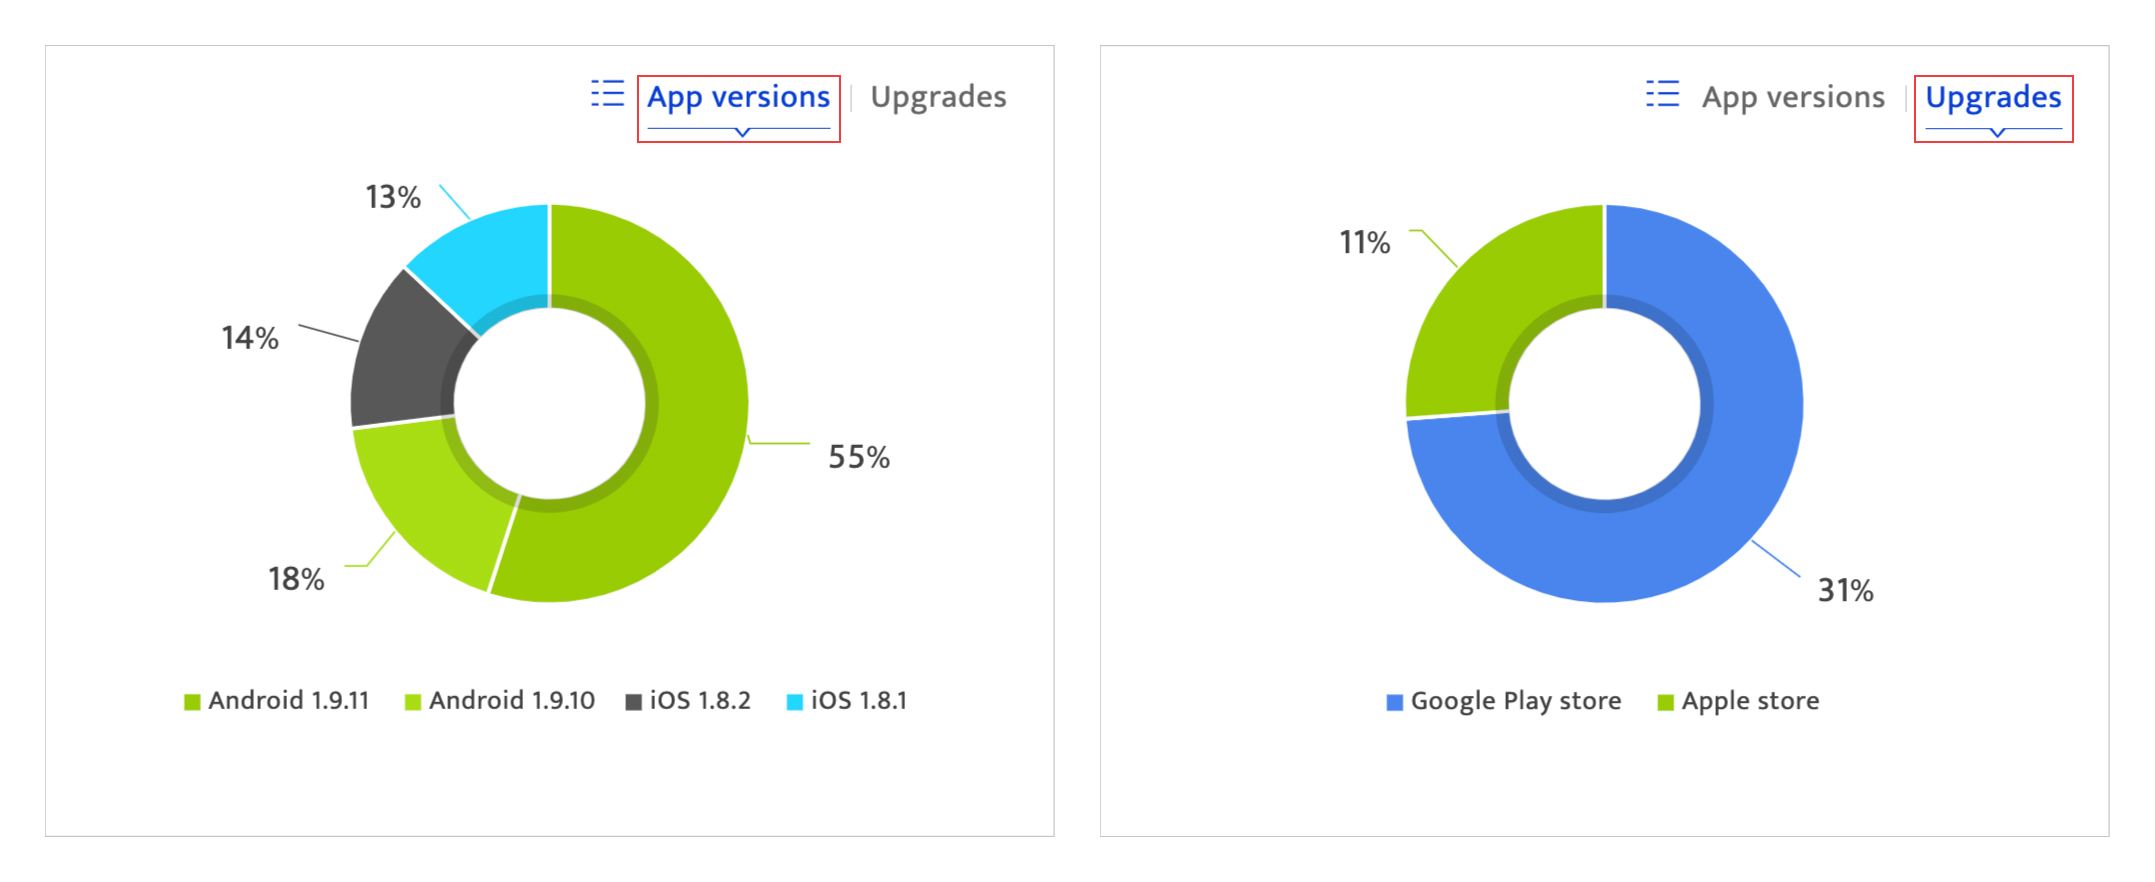
- App version/upgrade
- The app versions across OS
- Upgrades from app store types
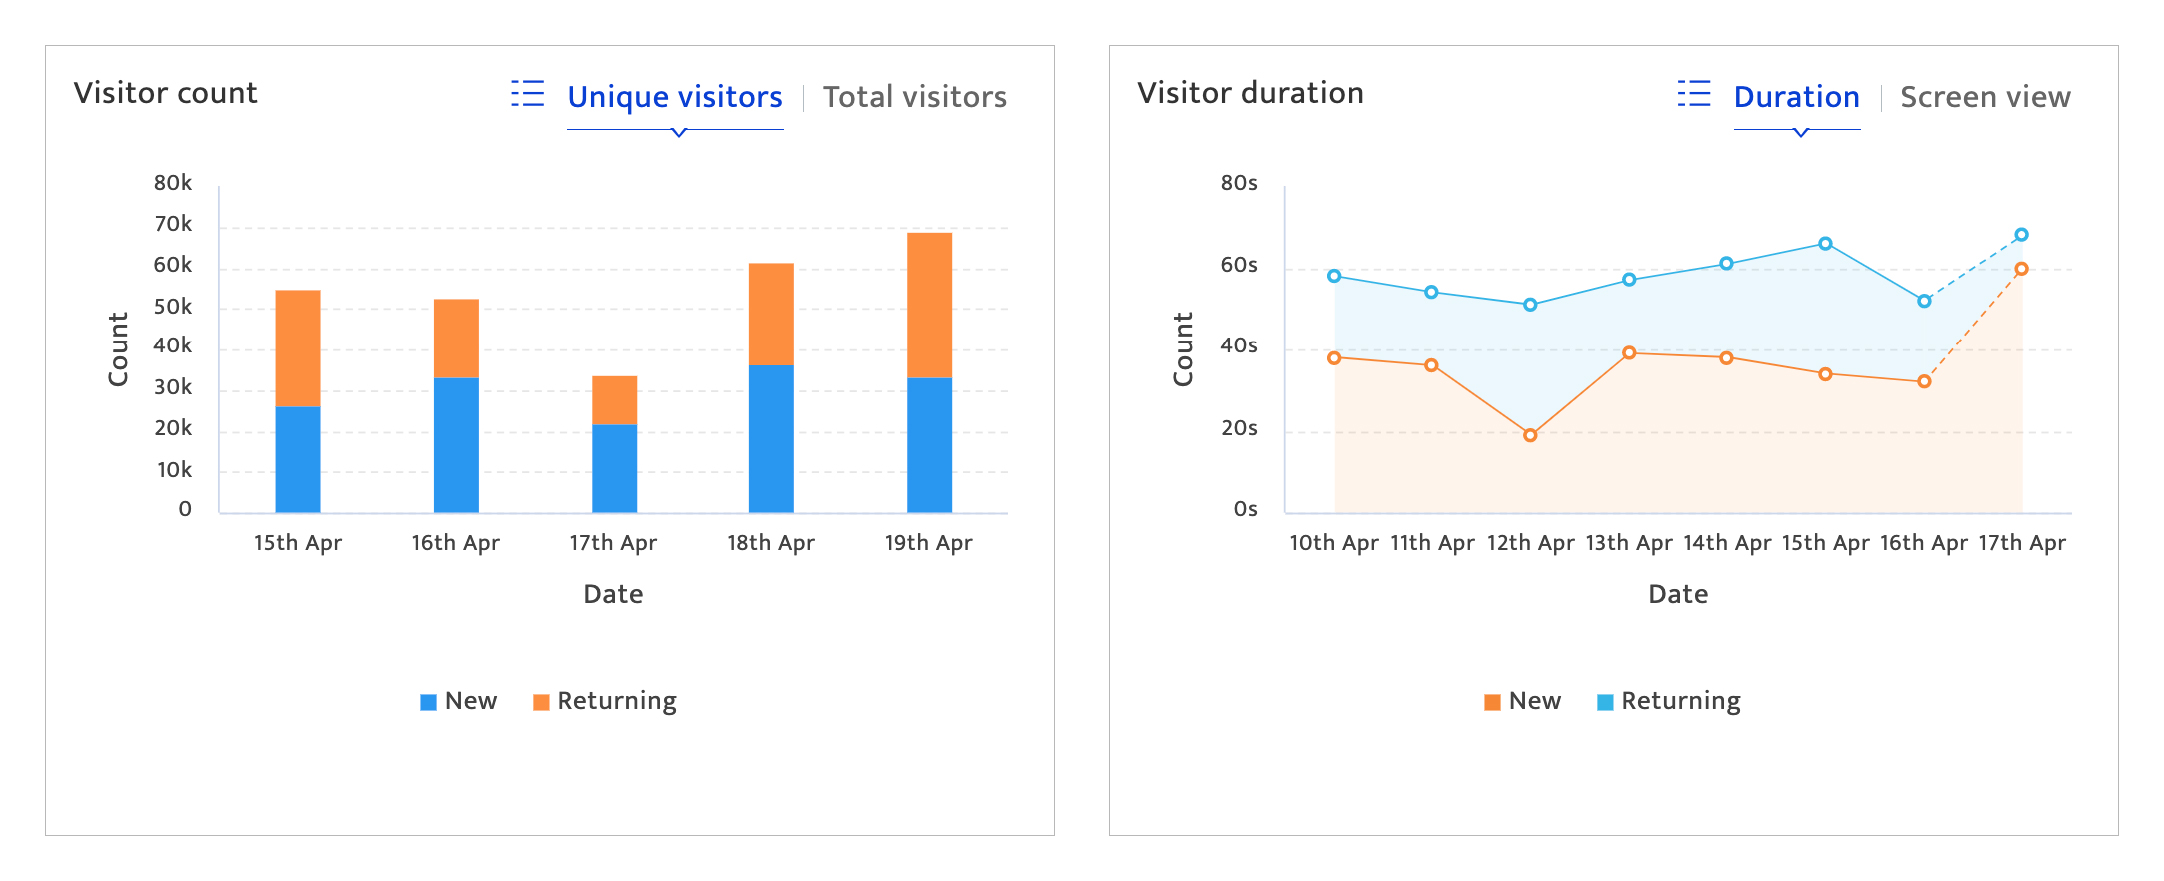
Average app metrics#
This section documents user behaviour on the mobile application. The metrics included here are:
- Total /unique visitors broken down by user type (new/returning)
- Daily average session time/ Screen views
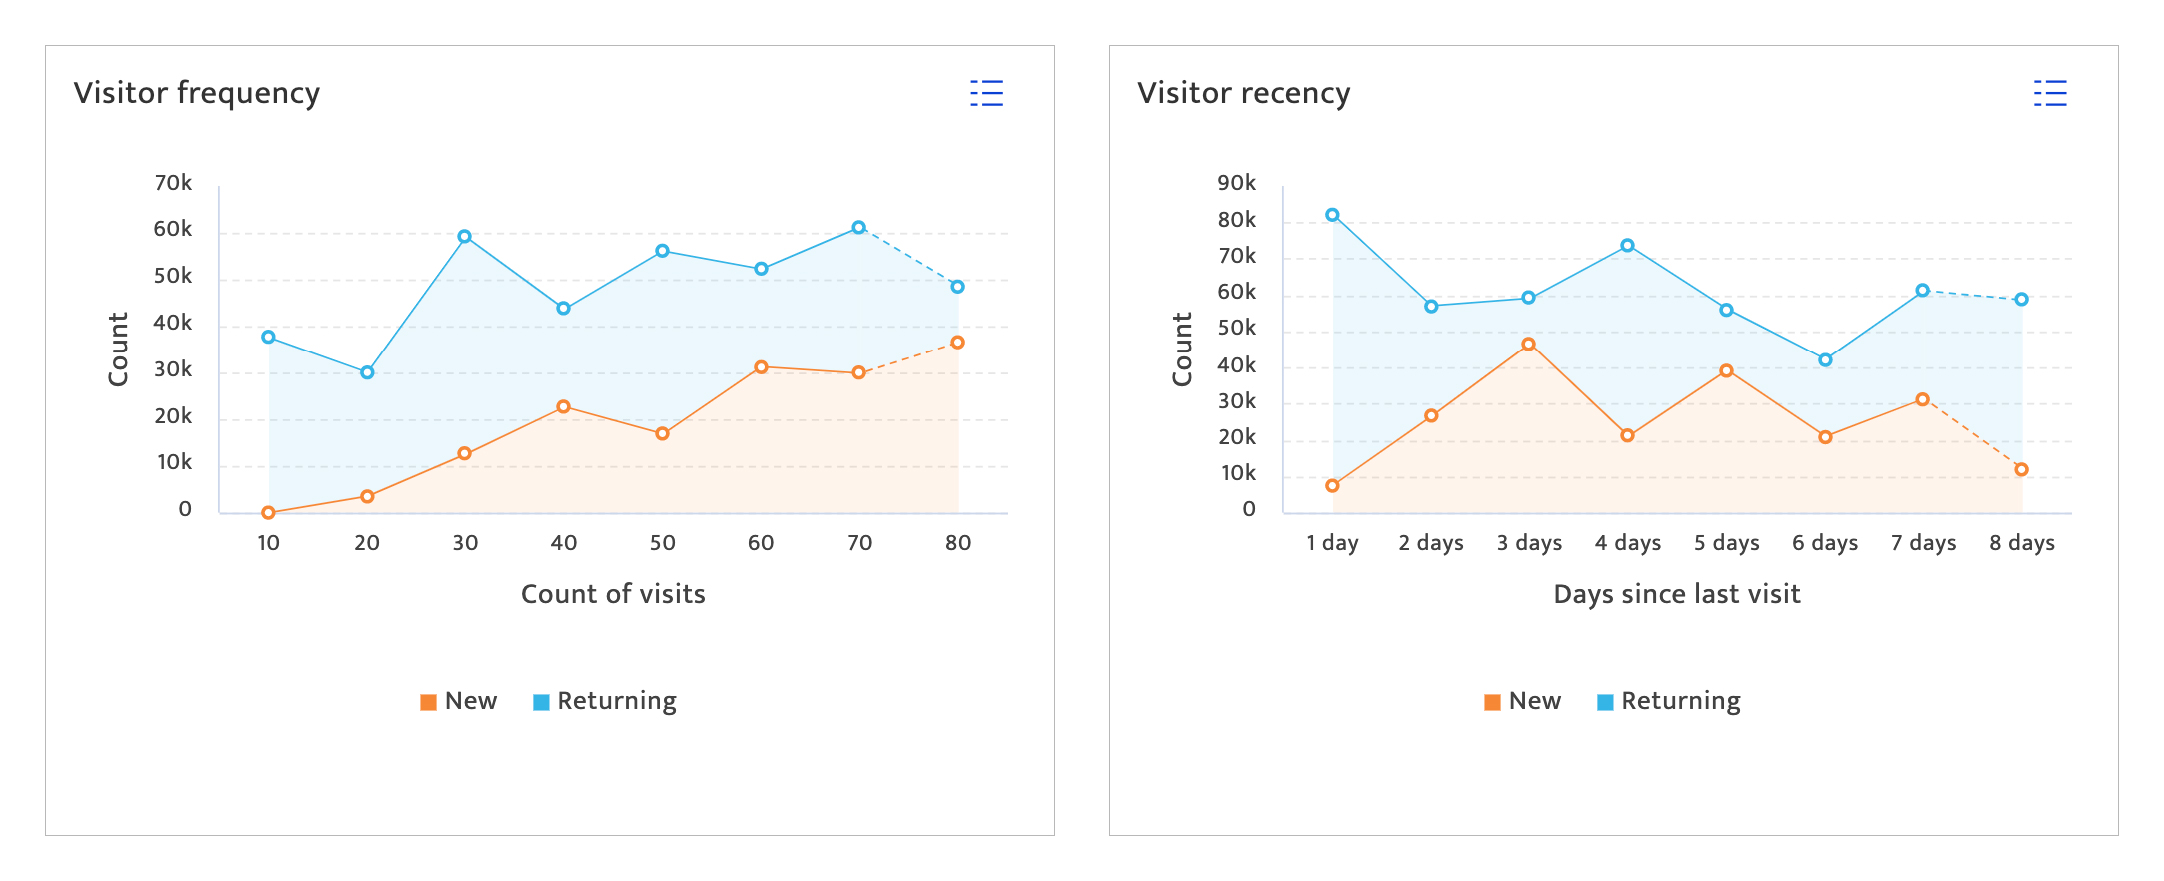
- Visitor frequency and recency broken down by user type
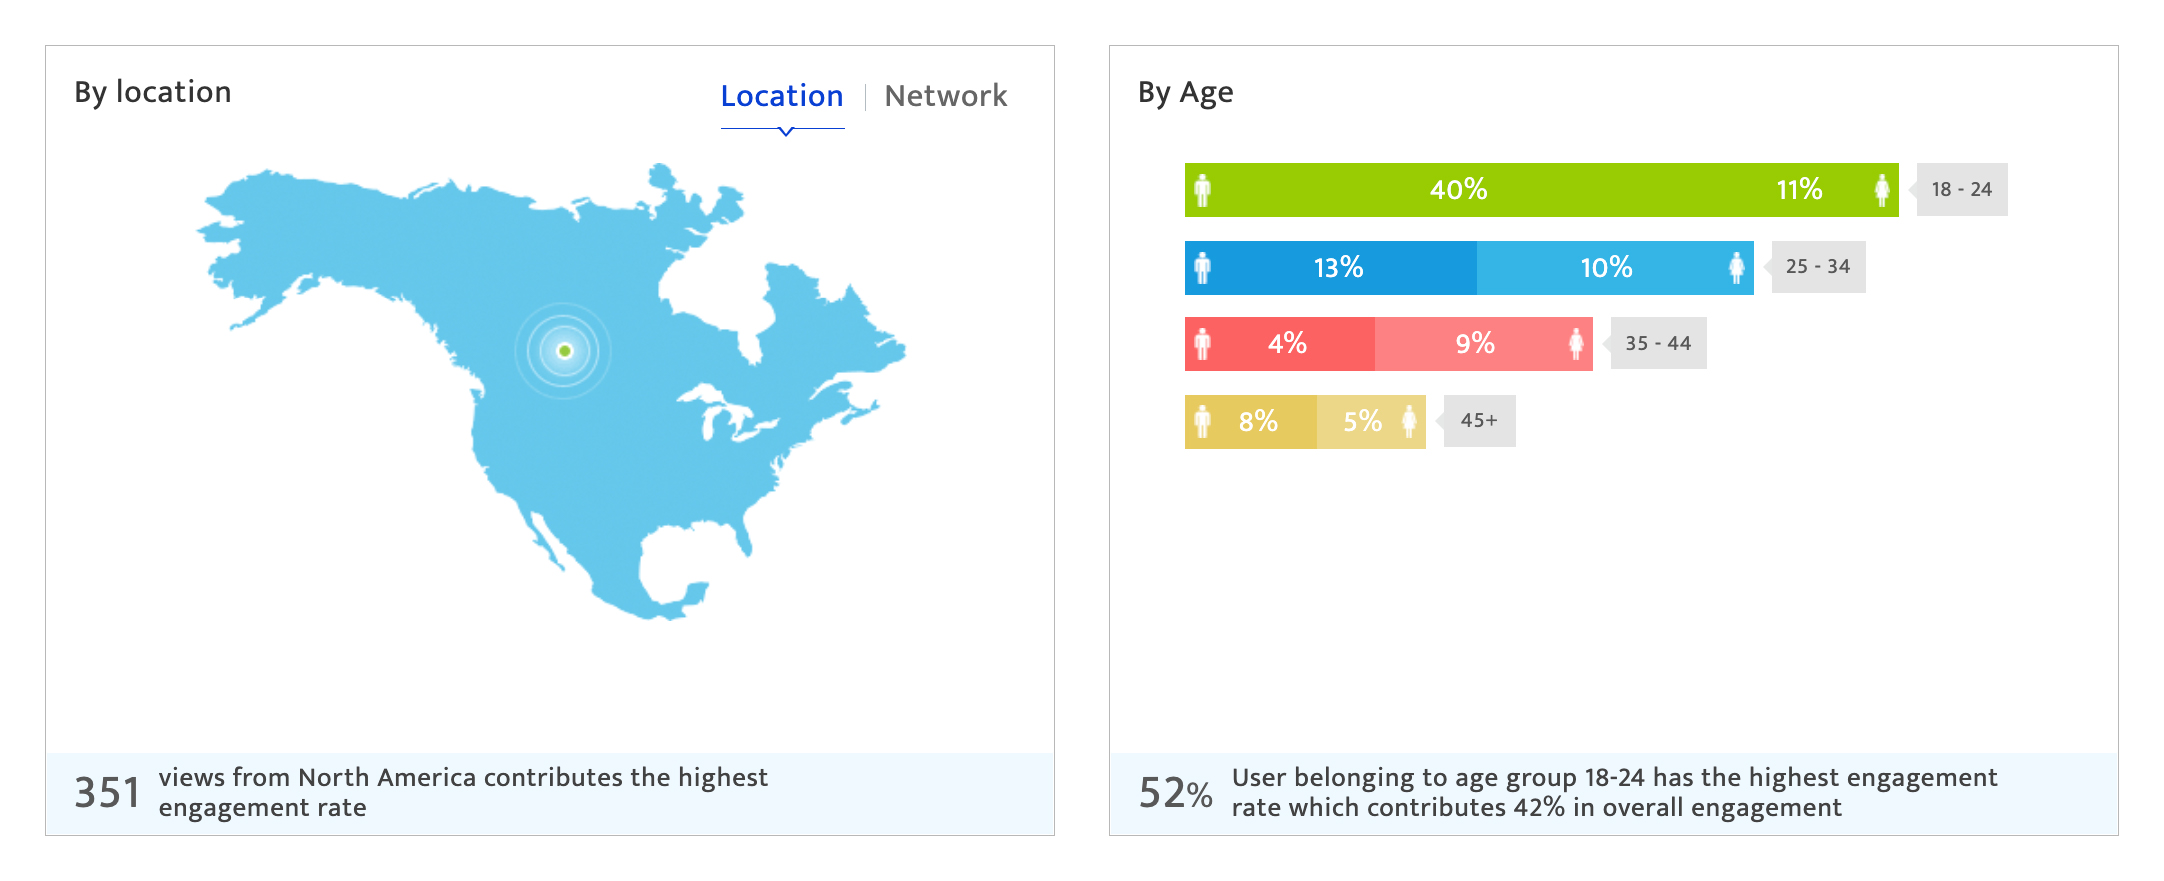
App user demographics#
- By location
This section documents the geography from which the maximum app store users have come.
- By age
This section documents age range wise breakdown (which is further broken-down into gender) of the total app users
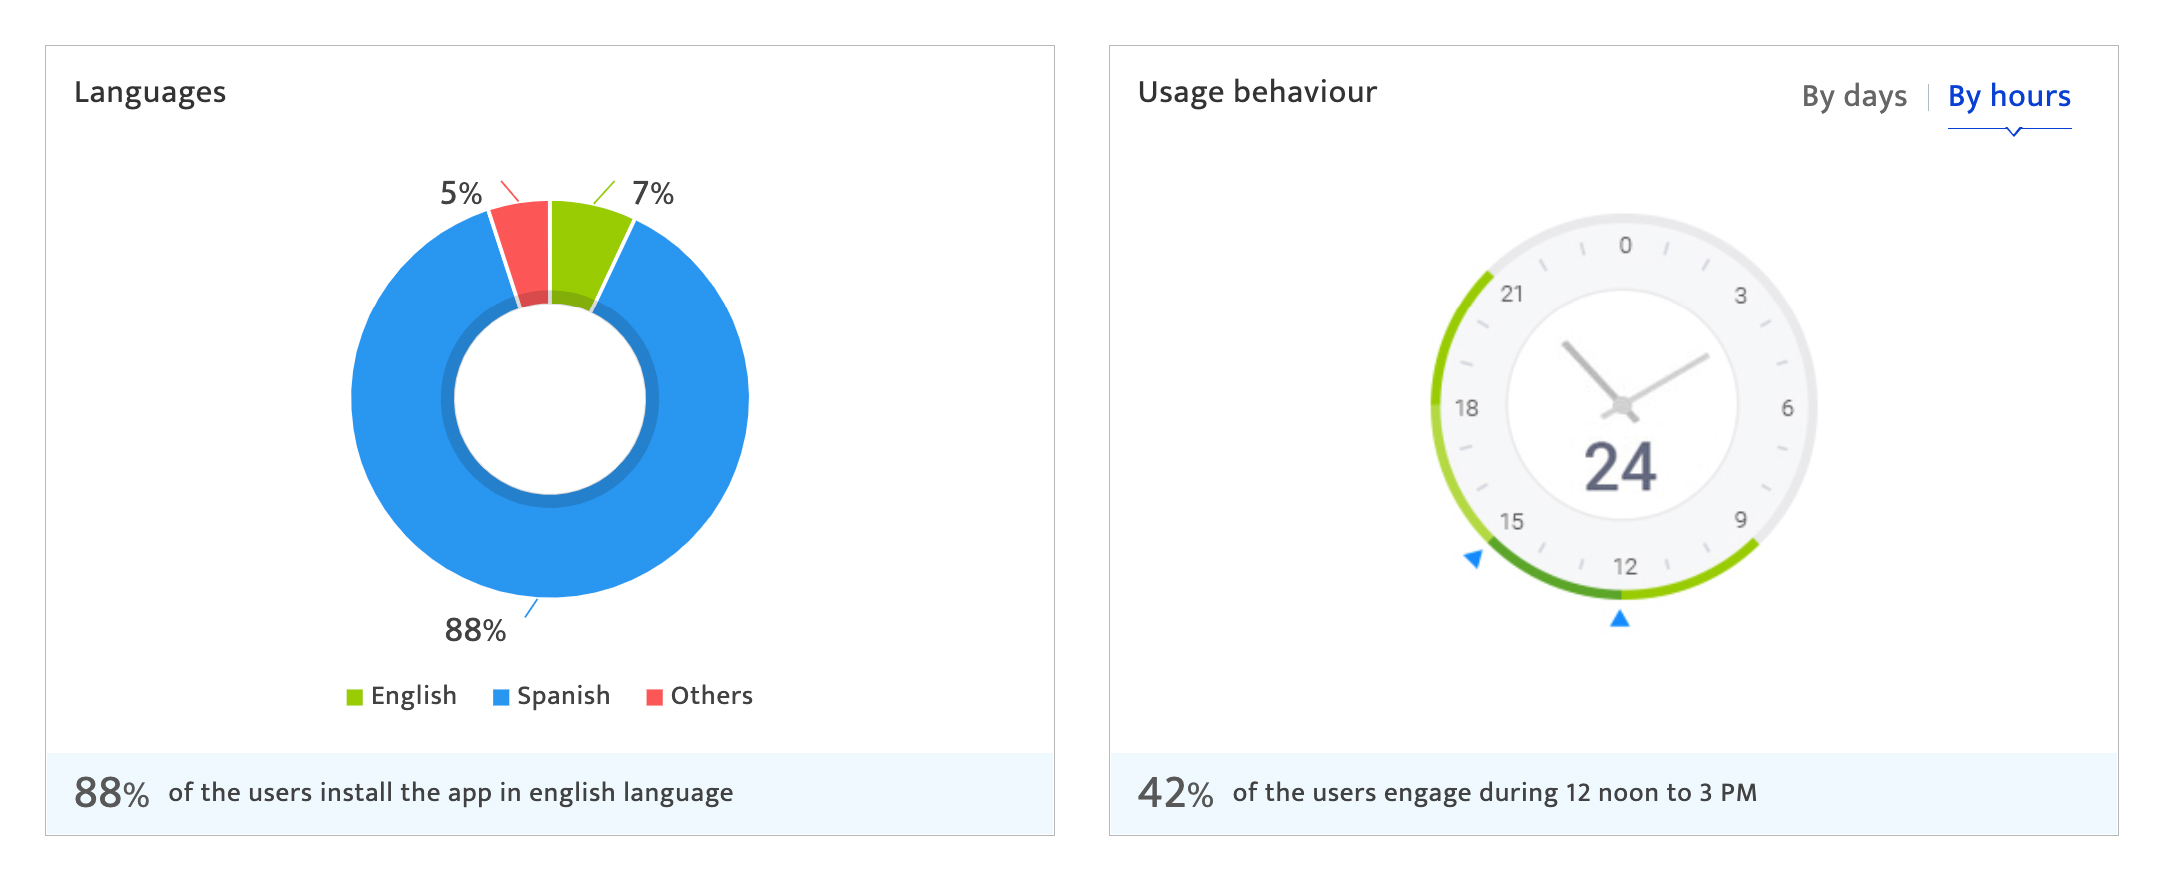
- By language
The section documents app users broken down by app language
- By Usage behaviour
This section documents the total visitors broken down by either day of the week or the time of the day when they visited app
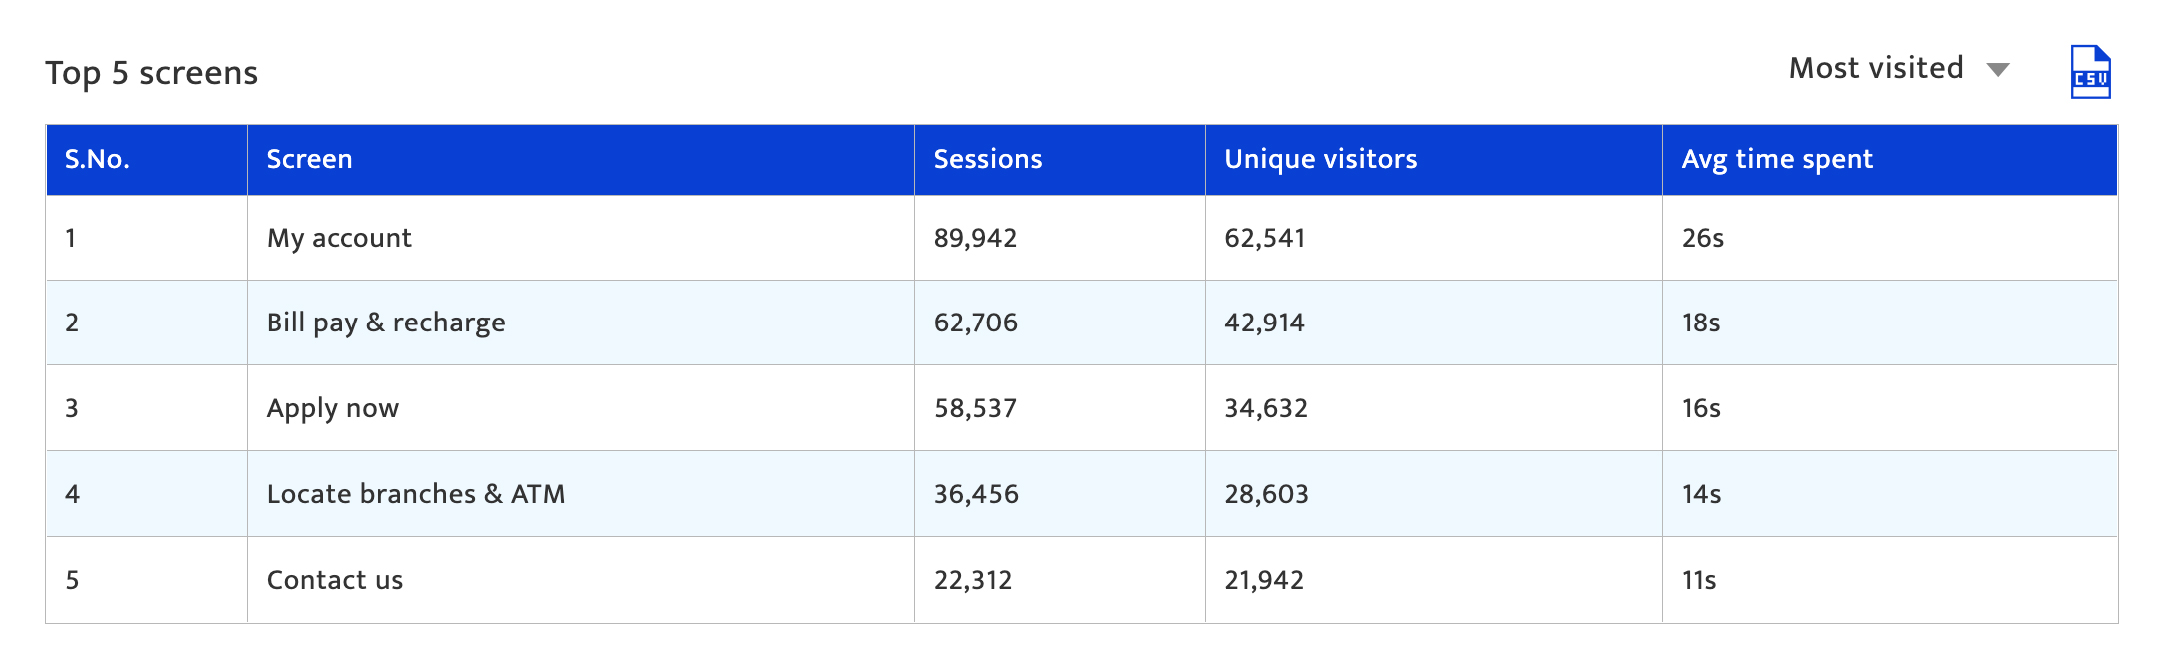
Top 5 screens#
This section documents the top 5 screens visited on the mobile app based on number of sessions. It also provides information on:
- Number of unique visitors
- Average time spent on each screens
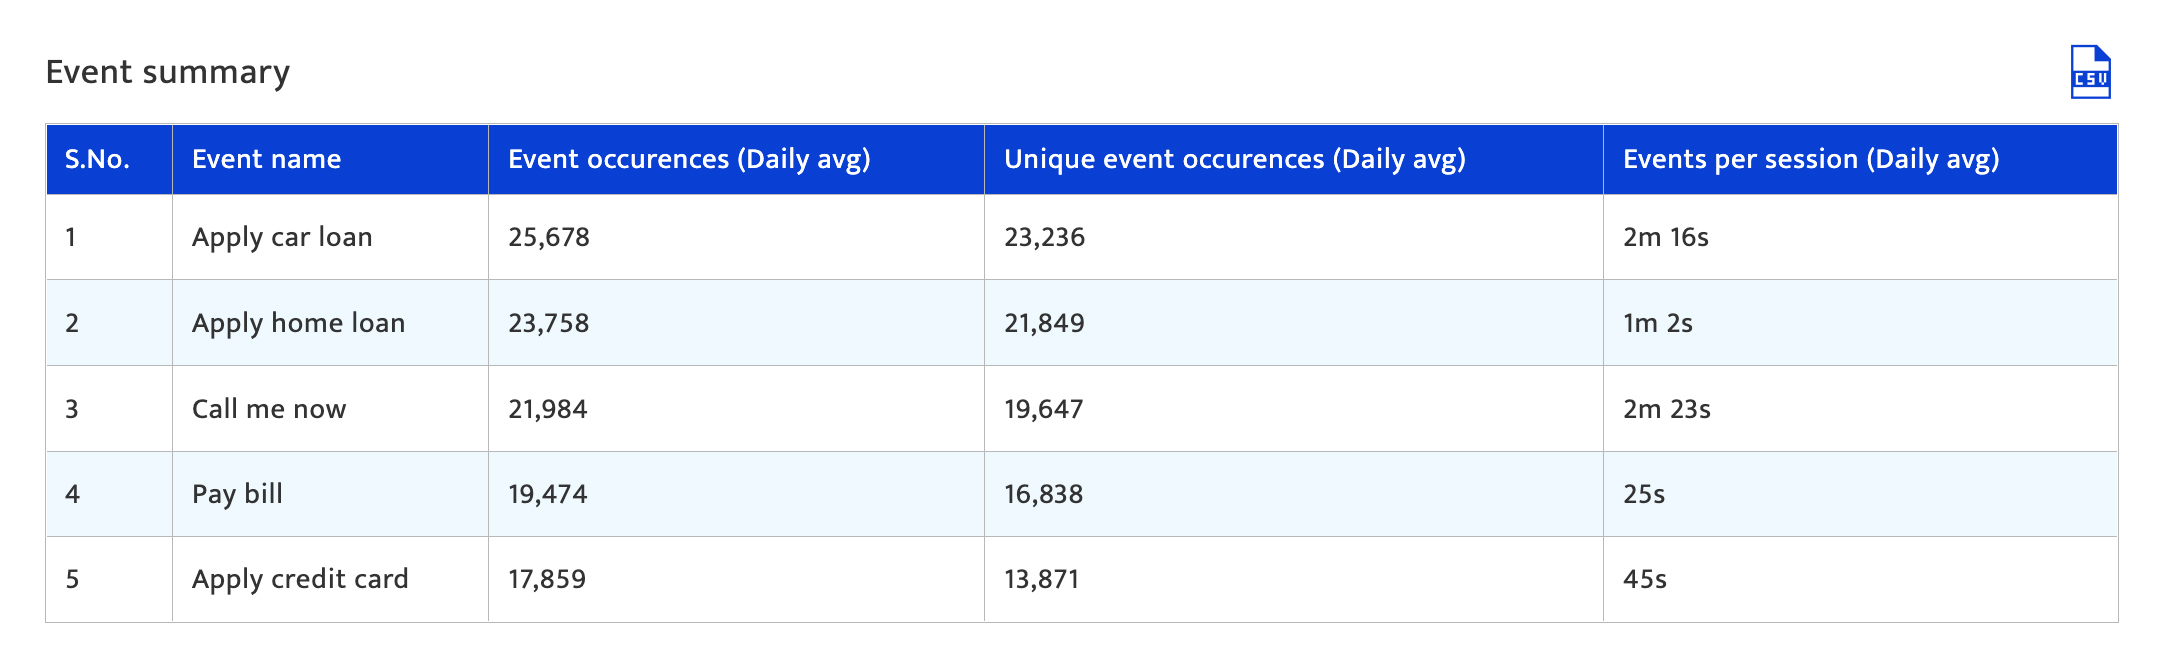
Top 5 events#
This section documents the top five events on the mobile app based on number of event occurrences (daily average). Italso provides information on:
- The number of unique event occurrences (daily avg),
- The session time by events (daily average)
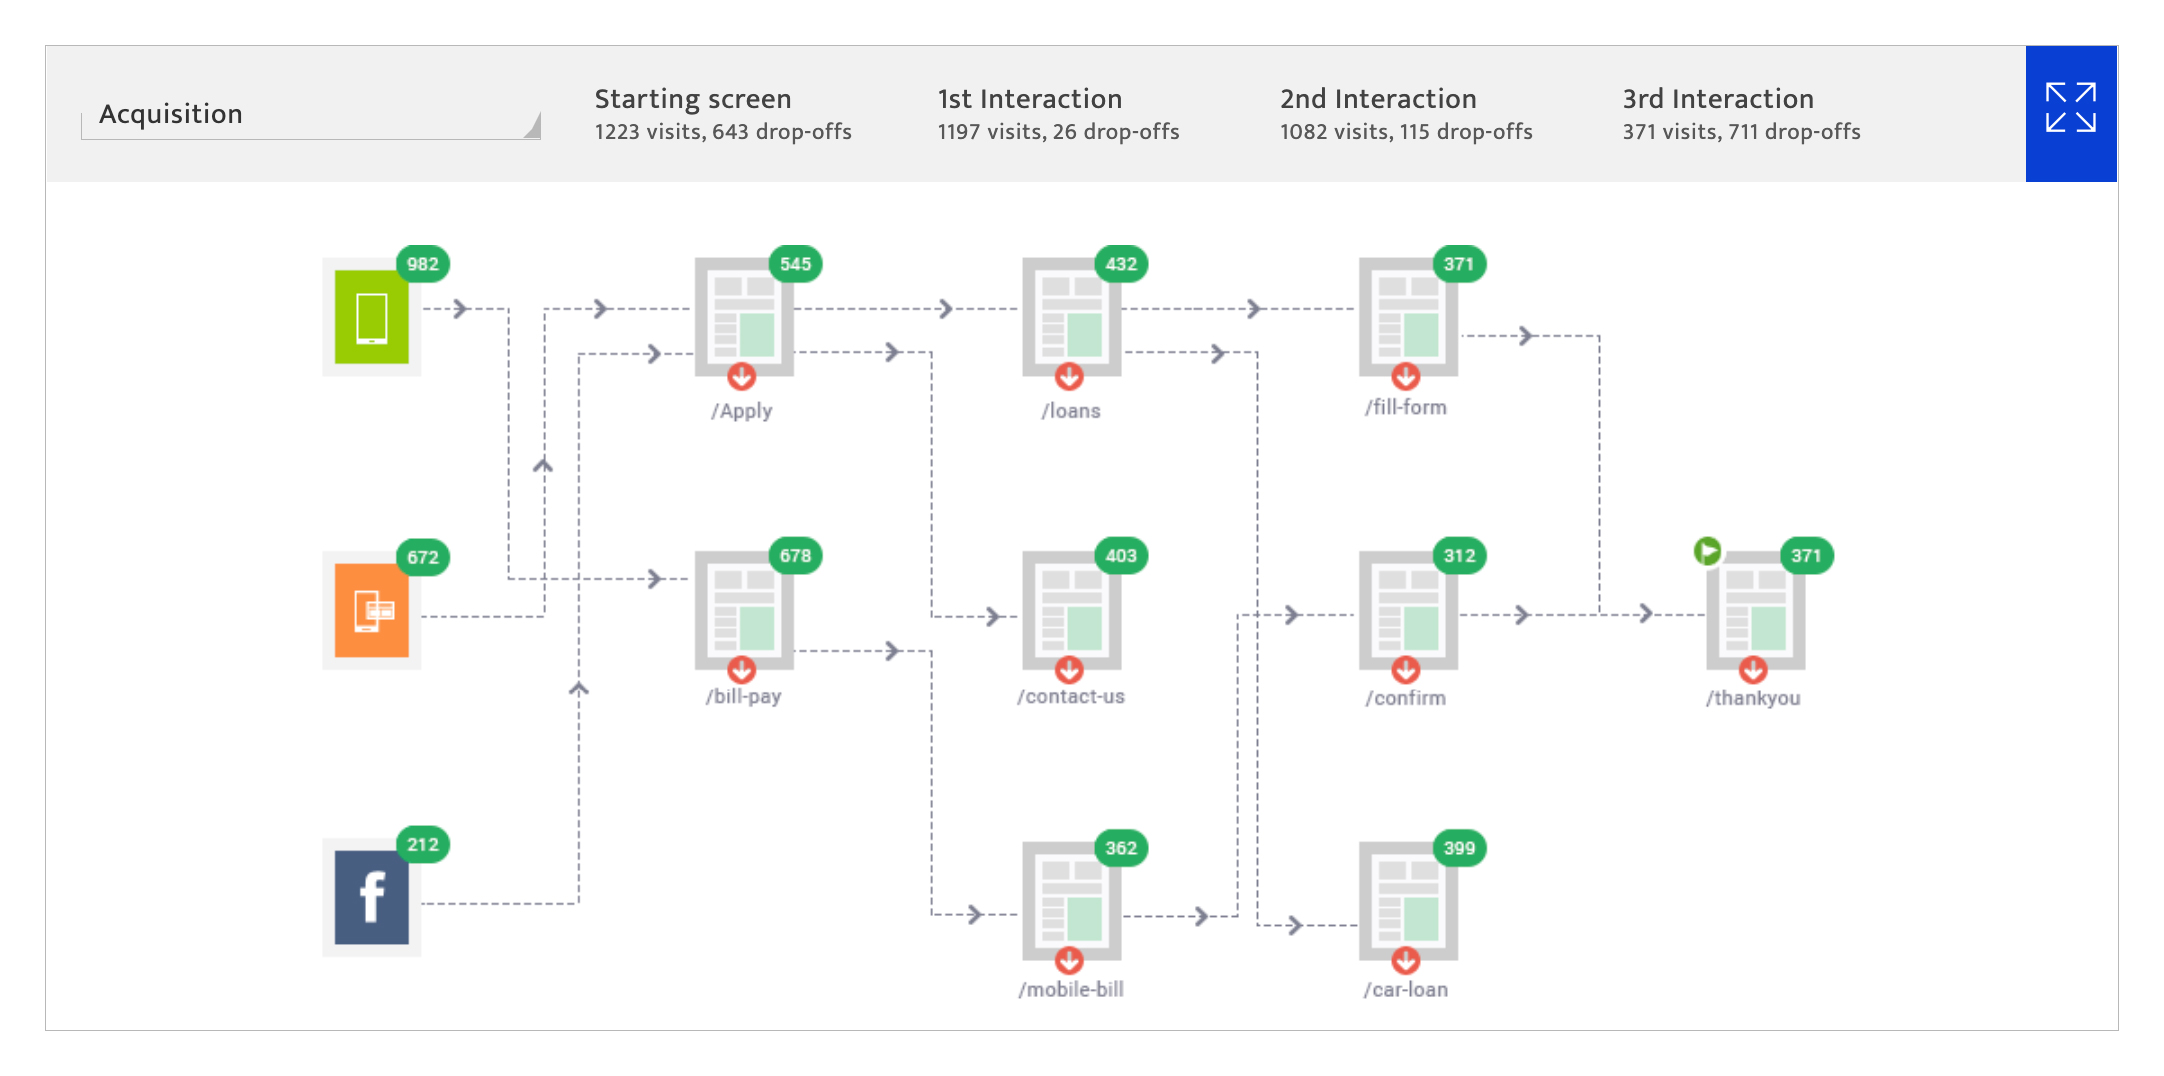
User interaction flow#
This section documents all the possible journeys that have occurred as a result of this campaign on the mobile app from source to conversion. It highlights the number of users at each stage in the journey highlighting key drop off areas
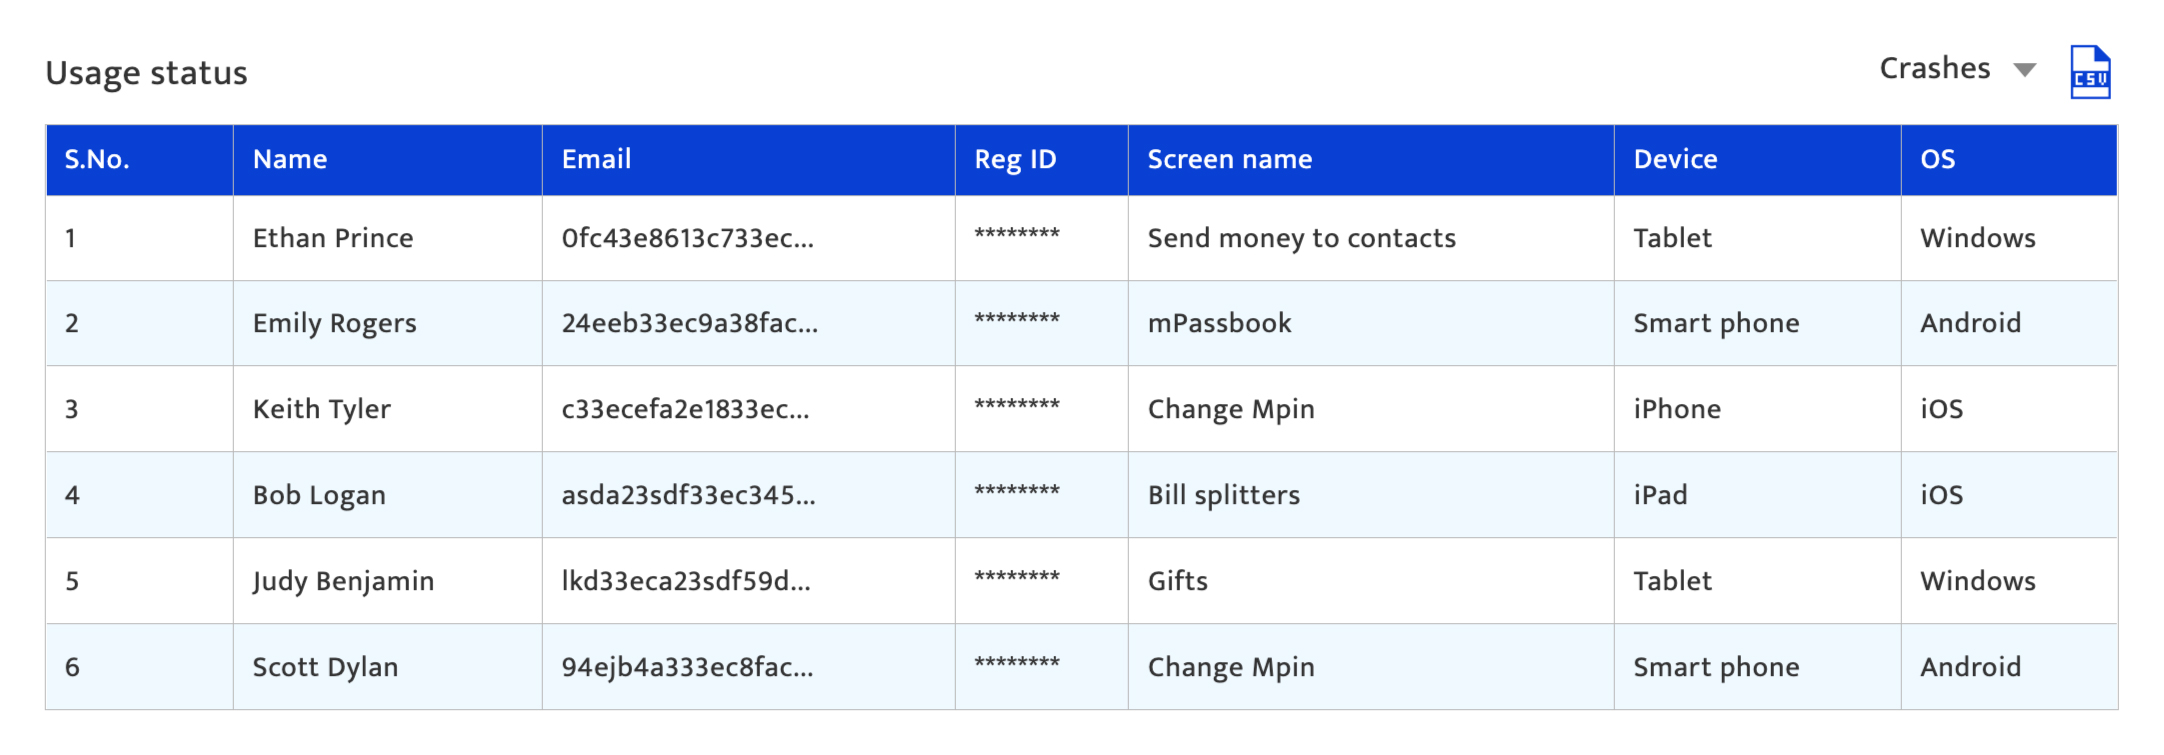
Usage status#
This section documents key usage information for those registered on the mobile app. Information for each registered user includes:
- Name
- Email id
- Registration id
- Received??
- Clicks???
- Device the app was registered on
- OS of the device